FOURTH QUARTER 2019 EARNINGS RELEASE DATED FEBRUARY 24, 2020
Published on February 24, 2020


Table of Contents
| Page | |||||
| Earnings Release | |||||
| Consolidated Statements of Operations | |||||
| Consolidated Balance Sheets | |||||
| Schedule 1 - Funds From Operations and Core Funds From Operations | |||||
| Schedule 2 - Other Non-GAAP Financial Measurements | |||||
| Schedule 3 - Portfolio Summary | |||||
| Schedule 4 - Debt and Equity Capitalization | |||||
| Schedule 5 - Summarized Information for Unconsolidated Real Estate Ventures | |||||
| Schedule 6 - Same Store Performance Summary By State | |||||
| Schedule 7 - Same Store Performance Summary By MSA | |||||
| Schedule 8 - Same Store Operating Data - Trailing Five Quarters | |||||
| Schedule 9 - Reconciliation of Same Store Data and Net Operating Income to Net Income | |||||
| Schedule 10 - Selected Financial Information | |||||
| Glossary | |||||
February 24, 2020
National Storage Affiliates Trust Reports 2019 Fourth Quarter and Full Year Results; Announces Internalization of Its Largest PRO
GREENWOOD VILLAGE, Colo. - (BUSINESS WIRE) - National Storage Affiliates Trust (“NSA” or the "Company") (NYSE: NSA) today reported the Company’s fourth quarter and full year 2019 results, and announced the internalization of the Company's largest participating regional operator ("PRO"), SecurCare Self Storage, Inc. ("SecurCare"), as well as the transition of the Company's Chief Operating Officer.
Fourth Quarter 2019 Highlights
•Reported net income of $18.8 million for the fourth quarter of 2019, an increase of 30.0% compared to the fourth quarter of 2018. Reported diluted earnings per share of $0.13 for the fourth quarter of 2019, primarily relating to the HLBV method for allocating net income among the various classes of equity.
•Reported core funds from operations ("Core FFO") of $36.8 million, or $0.40 per share for the fourth quarter of 2019, an increase of 8.1% per share compared to the fourth quarter of 2018.
•Achieved same store net operating income ("NOI") growth of 3.8% for the fourth quarter of 2019 compared to the same period in 2018, driven by a 2.8% increase in same store total revenues partially offset by a 0.3% increase in same store property operating expenses.
•Acquired seven wholly-owned self storage properties for $32.2 million during the fourth quarter of 2019. Consideration for these acquisitions included the issuance of approximately $2.0 million of OP equity.
Full Year 2019 Highlights
•Reported net income of $66.0 million for full year 2019, an increase of 17.2% compared to full year 2018. Reported diluted loss per share of $0.15 for full year 2019, primarily relating to the HLBV method for allocating net income among the various classes of equity.
•Reported Core FFO of $140.5 million, or $1.54 per share for full year 2019, an increase of 11.6% per share compared to full year 2018.
•Achieved same store NOI growth of 5.0% for full year 2019 compared to the same period in 2018, driven by a 4.0% increase in same store total revenues partially offset by a 1.6% increase in same store property operating expenses.
•Acquired 69 wholly-owned self storage properties for $447.8 million during full year 2019. Consideration for these acquisitions included the issuance of approximately $51.8 million of OP equity.
Highlights Subsequent to Year-End
•NSA has entered into a definitive agreement with SecurCare, the Company’s largest PRO, to acquire SecurCare in a merger and internalize its property management platform, which is expected to close during the second quarter of 2020, subject to customary closing conditions. As part of the internalization, NSA intends to offer employment to most of SecurCare's employees, including its key persons, to continue managing SecurCare's managed portfolio as members of NSA's property management platform. As a result of the merger, NSA will no longer pay any fees or reimbursements to SecurCare and distributions on the series of subordinated performance units related to SecurCare's managed portfolio will be discontinued. Further details regarding these transactions are contained in NSA's current report on Form 8-K, filed today with the SEC.
•In connection with the internalization of SecurCare, the Company's Board of Trustees approved the appointment of David Cramer, who is currently the president and chief executive officer of SecurCare, as NSA's Chief Operating Officer and Executive Vice President, with an expected effective date at or around the closing of the SecurCare merger, and accepted the resignation of Steven B. Treadwell from the same positions, to pursue other interests, effective at or around the same time. Mr. Nordhagen will continue to serve the Company in his capacity as executive chairman.
•NSA acquired 34 wholly-owned self storage properties for approximately $205.8 million and two joint venture properties totaling approximately $12.1 million.
1
Arlen Nordhagen, Executive Chairman of the Board of Trustees, commented, "As 2020 begins, we enter a transformational year for NSA. When we formed the Company in 2013, we envisioned a differentiated public self storage REIT that would leverage the benefits of integrating multiple experienced regional self storage operators to deliver consistently outstanding results to our shareholders. With the announcement of the internalization of SecurCare, we are excited to take the next step in the evolution of NSA and demonstrate that our unique structure can continue to build on the foundation of the stellar execution of our internal and external growth strategies since our IPO in 2015."
Mr. Nordhagen continued, "While we are sorry to see Steve Treadwell leave NSA to pursue an entrepreneurial opportunity, it is fortuitous that the timing of his departure coincides with the internalization of SecurCare so that Dave Cramer can immediately step into the role of COO. Dave and I have worked closely together for over 20 years, and Dave's wealth of knowledge and experience in the self storage industry will provide for a seamless transition during this next phase of the Company's growth."
Tamara Fischer, President and Chief Executive Officer, added, "We are very proud of what we accomplished during 2019, with a double digit increase in Core FFO per share driven by operating results that exceeded our expectations. As we look ahead to 2020, the expected accretion from the internalization of SecurCare is the realization of one of the key benefits of NSA's PRO structure. I look forward to working with Dave in his new role and continuing NSA's success."
Financial Results
($ in thousands, except per share and unit data) |
Three Months Ended December 31, | Year Ended December 31, | |||||||||||||||||||||||||||||||||
| 2019 | 2018 | Growth | 2019 | 2018 | Growth | ||||||||||||||||||||||||||||||
| Net income | $ | 18,826 | $ | 14,483 | 30.0 | % | $ | 66,013 | $ | 56,326 | 17.2 | % | |||||||||||||||||||||||
Funds From Operations ("FFO")(1)
|
$ | 36,218 | $ | 32,201 | 12.5 | % | $ | 139,151 | $ | 116,378 | 19.6 | % | |||||||||||||||||||||||
Add back acquisition costs |
534 | 192 | 178.1 | % | 1,317 | 663 | 98.6 | % | |||||||||||||||||||||||||||
Core FFO(1)
|
$ | 36,752 | $ | 32,393 | 13.5 | % | $ | 140,468 | $ | 117,041 | 20.0 | % | |||||||||||||||||||||||
| Earnings (loss) per share - basic | $ | 0.17 | $ | (0.16) | 206.3 | % | $ | (0.15) | $ | 0.07 | (314.3) | % | |||||||||||||||||||||||
Earnings (loss) per share - diluted |
$ | 0.13 | $ | (0.16) | 181.3 | % | $ | (0.15) | $ | 0.07 | (314.3) | % | |||||||||||||||||||||||
FFO per share and unit(1)
|
$ | 0.39 | $ | 0.37 | 5.4 | % | $ | 1.53 | $ | 1.37 | 11.7 | % | |||||||||||||||||||||||
Core FFO per share and unit(1)
|
$ | 0.40 | $ | 0.37 | 8.1 | % | $ | 1.54 | $ | 1.38 | 11.6 | % | |||||||||||||||||||||||
(1) Non-GAAP financial measures, including FFO, Core FFO and NOI, are defined in the Glossary in the supplemental financial information and, where appropriate, reconciliations of these measures and other non-GAAP financial measures to their most directly comparable GAAP measures are included in the Schedules to this press release and in the supplemental financial information.
Net income increased $4.3 million for the fourth quarter of 2019 and $9.7 million for full year 2019 as compared to the same periods in 2018. The increases primarily resulted from additional NOI generated from the 69 wholly-owned self storage properties acquired during full year 2019 and same store NOI growth, partially offset by increases in depreciation and amortization and interest expense.
The increases in FFO and Core FFO for the fourth quarter of 2019 and full year 2019 were primarily the result of incremental NOI from properties acquired during full year 2019 and same store NOI growth, partially offset by higher interest expense and increases in distributions to subordinated performance unitholders.
2
Same Store Operating Results (439 Stores)
($ in thousands, except per square foot data) |
Three Months Ended December 31, | Year Ended December 31, | |||||||||||||||||||||||||||||||||
| 2019 | 2018 | Growth | 2019 | 2018 | Growth | ||||||||||||||||||||||||||||||
Total revenues |
$ | 74,792 | $ | 72,775 | 2.8 | % | $ | 297,177 | $ | 285,820 | 4.0 | % | |||||||||||||||||||||||
Property operating expenses |
21,763 | 21,705 | 0.3 | % | 88,694 | 87,262 | 1.6 | % | |||||||||||||||||||||||||||
Net Operating Income (NOI) |
$ | 53,029 | $ | 51,070 | 3.8 | % | $ | 208,483 | $ | 198,558 | 5.0 | % | |||||||||||||||||||||||
| NOI Margin | 70.9 | % | 70.2 | % | 0.7 | % | 70.2 | % | 69.5 | % | 0.7 | % | |||||||||||||||||||||||
Average Occupancy |
88.2 | % | 88.2 | % | — | 88.8 | % | 88.5 | % | 0.3 | % | ||||||||||||||||||||||||
Average Annualized Rental Revenue Per Occupied Square Foot |
$ | 12.14 | $ | 11.83 | 2.6 | % | $ | 11.98 | $ | 11.58 | 3.5 | % | |||||||||||||||||||||||
Year-over-year same store total revenues increased 2.8% for the fourth quarter of 2019 and 4.0% for full year 2019 as compared to the same periods in 2018. The increases were driven primarily by a 2.6% increase in average annualized rental revenue per occupied square foot for the fourth quarter of 2019 and a 3.5% increase in average annualized rental revenue per occupied square foot for full year 2019. Markets that generated above portfolio average same store total revenue growth include: Riverside-San Bernardino, Atlanta, and Las Vegas. Markets that generated below portfolio average same store total revenue growth include: Portland, Dallas and Tulsa.
Year-over-year same store property operating expenses increased 0.3% for the fourth quarter of 2019 and 1.6% for full year 2019 as compared to the same periods in 2018. For the fourth quarter of 2019, the increase primarily resulted from increases in personnel costs, general and administrative expenses and advertising costs, substantially offset by decreases in property taxes. The decreases in property taxes resulted primarily from unexpected favorable property tax assessments recorded during the fourth quarter of 2019. For full year 2019, the increase primarily resulted from increases in repairs and maintenance expenses, personnel costs and property taxes.
Investment Activity
NSA acquired seven wholly-owned self storage properties located across three states consisting of approximately 0.3 million rentable square feet configured in approximately 2,500 storage units during the fourth quarter of 2019. Total consideration for these acquisitions of $32.2 million included approximately $30.0 million of net cash, the issuance of approximately $0.2 million of OP units, $1.8 million of subordinated performance units and the assumption of approximately $0.2 million of other working capital liabilities.
During the full year 2019, NSA invested $447.8 million in the acquisition of 69 wholly-owned self storage properties located across 14 states consisting of approximately 4.2 million rentable square feet configured in approximately 33,000 storage units.
Common Share Dividends
On November 20, 2019, NSA's Board of Trustees declared a quarterly cash dividend of $0.33 per common share, which was paid on December 31, 2019 to shareholders of record as of December 13, 2019.
3
2020 Guidance
The Company's outlook for 2020 incorporates the effect of the SecurCare internalization assuming an effective date of April 1, 2020, which is expected to be accretive to Core FFO per share by approximately $0.03 in 2020, or $0.04 - $0.05 on an annualized basis.
The following table outlines NSA's FFO guidance estimates and related assumptions for the year ended December 31, 2020:
| Ranges for Full Year 2020 | |||||||||||
| Low | High | ||||||||||
Core FFO per share(1)
|
$1.64 | $1.68 | |||||||||
| Same store operations (500 stores) | |||||||||||
Total revenue growth |
2.25% | 3.25% | |||||||||
Property operating expenses growth |
3.0% | 4.0% | |||||||||
NOI growth |
2.0% | 3.0% | |||||||||
General and administrative expenses |
|||||||||||
General and administrative expenses (excluding equity-based compensation) |
$41.0 | $43.0 | |||||||||
| Equity-based compensation | $4.5 | $5.0 | |||||||||
Management fees and other revenue, in millions |
$21.0 | $23.0 | |||||||||
Core FFO from unconsolidated real estate ventures, in millions |
$15.0 | $16.0 | |||||||||
Subordinated performance unit distributions, in millions |
$28.0 | $30.0 | |||||||||
| Wholly-owned acquisitions, in millions | $400.0 | $600.0 | |||||||||
| Joint venture acquisitions, in millions | $25.0 | $50.0 | |||||||||
(1) The following table provides a reconciliation of the range of estimated earnings (loss) per share - diluted to estimated Core FFO per share and unit:
|
|||||||||||
| Ranges for Full Year 2020 | |||||||||||
| Low | High | ||||||||||
| Earnings (loss) per share - diluted | $0.00 | $0.20 | |||||||||
Impact of the difference in weighted average number of shares and GAAP accounting for noncontrolling interests, two-class method and treasury stock method |
0.67 | 0.47 | |||||||||
Add real estate depreciation and amortization, including NSA's share of unconsolidated venture real estate depreciation and amortization |
1.23 | 1.29 | |||||||||
FFO attributable to subordinated unitholders |
(0.28) | (0.30) | |||||||||
Add acquisition costs and NSA's share of unconsolidated real estate venture acquisition costs |
0.02 | 0.02 | |||||||||
Core FFO per share and unit |
$1.64 | $1.68 | |||||||||
Supplemental Financial Information
The full text of this earnings release and supplemental financial information, including certain financial information referenced in this release, are available on NSA's website at http://ir.nationalstorageaffiliates.com/quarterly-reporting and as exhibit 99.1 to the Company's Form 8-K furnished to the SEC on February 24, 2020.
4
Non-GAAP Financial Measures & Glossary
This press release contains certain non-GAAP financial measures. These non-GAAP measures are presented because NSA's management believes these measures help investors understand NSA's business, performance and ability to earn and distribute cash to its shareholders by providing perspectives not immediately apparent from net income (loss). These measures are also frequently used by securities analysts, investors and other interested parties. The presentations of FFO, Core FFO and NOI in this press release are not intended to be considered in isolation or as a substitute for, or superior to, the financial information prepared and presented in accordance with GAAP. In addition, NSA's method of calculating these measures may be different from methods used by other companies, and, accordingly, may not be comparable to similar measures as calculated by other companies that do not use the same methodology as NSA. These measures, and other words and phrases used herein, are defined in the Glossary in the supplemental financial information and, where appropriate, reconciliations of these measures and other non-GAAP financial measures to their most directly comparable GAAP measures are included in the Schedules to this press release and in the supplemental financial information.
Quarterly Teleconference and Webcast
The Company will host a conference call at 11:00 am Eastern Time on Tuesday, February 25, 2020 to discuss its financial results. At the conclusion of the call, management will accept questions from certified financial analysts. All other participants are encouraged to listen to a webcast of the call by accessing the link found on the Company's website at www.nationalstorageaffiliates.com.
Conference Call and Webcast:
Date/Time: Tuesday, February 25, 2020, 11:00am ET
Webcast available at: www.nationalstorageaffiliates.com
Domestic (Toll Free US & Canada): 877.407.9711
International: 412.902.1014
Replay:
Domestic (Toll Free US & Canada): 877.660.6853
International: 201.612.7415
Conference ID: 13692161
A replay of the call will be available for one week through Tuesday, March 3, 2020. A replay of the webcast will be available for 30 days on NSA's website at www.nationalstorageaffiliates.com.
Upcoming Industry Conference
NSA management is scheduled to participate in Citi’s 25th Annual Global Property CEO Conference on March 2 – 4, 2020 in Hollywood, Florida.
About National Storage Affiliates Trust
National Storage Affiliates Trust is a Maryland real estate investment trust focused on the ownership, operation and acquisition of self storage properties located within the top 100 metropolitan statistical areas throughout the United States. As of December 31, 2019, the Company held ownership interests in and operated 742 self storage properties located in 35 states and Puerto Rico with approximately 47.1 million rentable square feet. NSA is one of the largest owners and operators of self storage properties among public and private companies in the United States. For more information, please visit the Company’s website at www.nationalstorageaffiliates.com. NSA is included in the MSCI US REIT Index (RMS/RMZ), the Russell 2000 Index of Companies and the S&P SmallCap 600 Index.
5
NOTE REGARDING FORWARD LOOKING STATEMENTS
Certain statements contained in this press release constitute forward-looking statements as such term is defined in Section 27A of the Securities Act of 1933, as amended, and Section 21E of the Securities Exchange Act of 1934, as amended, and such statements are intended to be covered by the safe harbor provided by the same. Forward-looking statements are subject to substantial risks and uncertainties, many of which are difficult to predict and are generally beyond the Company's control. These forward-looking statements include information about possible or assumed future results of the Company's business, financial condition, liquidity, results of operations, plans and objectives. Changes in any circumstances may cause the Company's actual results to differ significantly from those expressed in any forward-looking statement. When used in this release, the words "believe," "expect," "anticipate," "estimate," "plan," "continue," "intend," "should," "may" or similar expressions are intended to identify forward-looking statements. Statements regarding the following subjects, among others, may be forward-looking: market trends in the Company's industry, interest rates, the debt and lending markets or the general economy; the Company's business and investment strategy; the acquisition of properties, including those under contract and our ability to execute on our acquisition pipeline; the timing of acquisitions under contract; the internalization of retiring participating regional operators ("PROs") into the Company; and the Company's guidance estimates for the year ended December 31, 2020. For a further list and description of such risks and uncertainties, see the Company's most recent Annual Report on Form 10-K filed with the Securities and Exchange Commission, and the other documents filed by the Company with the Securities and Exchange Commission. The forward-looking statements, and other risks, uncertainties and factors are based on the Company's beliefs, assumptions and expectations of its future performance, taking into account all information currently available to the Company. Forward-looking statements are not predictions of future events. The Company disclaims any intention or obligation to update or revise any forward-looking statements, whether as a result of new information, future events or otherwise, except as required by law.
Contact:
National Storage Affiliates Trust
Investor/Media Relations
George Hoglund, CFA
Vice President - Investor Relations
720.630.2160
6
National Storage Affiliates Trust
Consolidated Statements of Operations
(in thousands, except per share amounts)
(unaudited)
| Three Months Ended December 31, | Year Ended December 31, | ||||||||||||||||||||||
| 2019 | 2018 | 2019 | 2018 | ||||||||||||||||||||
| REVENUE | |||||||||||||||||||||||
| Rental revenue | $ | 92,083 | $ | 81,826 | $ | 354,859 | $ | 308,403 | |||||||||||||||
| Other property-related revenue | 3,133 | 2,626 | 12,302 | 10,183 | |||||||||||||||||||
| Management fees and other revenue | 5,352 | 4,846 | 20,735 | 12,310 | |||||||||||||||||||
| Total revenue | 100,568 | 89,298 | 387,896 | 330,896 | |||||||||||||||||||
| OPERATING EXPENSES | |||||||||||||||||||||||
| Property operating expenses | 27,712 | 26,913 | 110,347 | 103,875 | |||||||||||||||||||
| General and administrative expenses | 11,606 | 10,606 | 45,581 | 36,220 | |||||||||||||||||||
| Depreciation and amortization | 27,343 | 22,921 | 105,119 | 89,147 | |||||||||||||||||||
| Total operating expenses | 66,661 | 60,440 | 261,047 | 229,242 | |||||||||||||||||||
| OTHER (EXPENSE) INCOME | |||||||||||||||||||||||
| Interest expense | (14,874) | (11,961) | (56,464) | (42,724) | |||||||||||||||||||
Equity in losses of unconsolidated real estate ventures |
(8) | (1,713) | (4,970) | (1,423) | |||||||||||||||||||
| Acquisition costs | (534) | (192) | (1,317) | (663) | |||||||||||||||||||
| Non-operating income (expense) | 727 | (160) | 452 | (91) | |||||||||||||||||||
| Gain on sale of self storage properties | — | — | 2,814 | 391 | |||||||||||||||||||
| Other expense | (14,689) | (14,026) | (59,485) | (44,510) | |||||||||||||||||||
| Income before income taxes | 19,218 | 14,832 | 67,364 | 57,144 | |||||||||||||||||||
| Income tax expense | (392) | (349) | (1,351) | (818) | |||||||||||||||||||
| Net income | 18,826 | 14,483 | 66,013 | 56,326 | |||||||||||||||||||
Net income attributable to noncontrolling interests |
(5,738) | (21,119) | (62,030) | (42,217) | |||||||||||||||||||
| Net income (loss) attributable to National Storage Affiliates Trust | 13,088 | (6,636) | 3,983 | 14,109 | |||||||||||||||||||
Distributions to preferred shareholders |
(3,273) | (2,587) | (12,390) | (10,350) | |||||||||||||||||||
Net income (loss) attributable to common shareholders |
$ | 9,815 | $ | (9,223) | $ | (8,407) | $ | 3,759 | |||||||||||||||
| Earnings (loss) per share - basic | $ | 0.17 | $ | (0.16) | $ | (0.15) | $ | 0.07 | |||||||||||||||
| Earnings (loss) per share - diluted | $ | 0.13 | $ | (0.16) | $ | (0.15) | $ | 0.07 | |||||||||||||||
Weighted average shares outstanding - basic |
59,316 | 56,571 | 58,208 | 53,293 | |||||||||||||||||||
Weighted average shares outstanding - diluted |
114,422 | 56,571 | 58,208 | 53,293 | |||||||||||||||||||
7
National Storage Affiliates Trust
Consolidated Balance Sheets
(dollars in thousands, except per share amounts)
(unaudited)
| December 31, | |||||||||||
| 2019 | 2018 | ||||||||||
| ASSETS | |||||||||||
| Real estate | |||||||||||
| Self storage properties | $ | 3,091,719 | $ | 2,637,723 | |||||||
| Less accumulated depreciation | (337,822) | (246,261) | |||||||||
| Self storage properties, net | 2,753,897 | 2,391,462 | |||||||||
| Cash and cash equivalents | 20,558 | 13,181 | |||||||||
| Restricted cash | 3,718 | 3,182 | |||||||||
| Debt issuance costs, net | 3,264 | 1,260 | |||||||||
| Investment in unconsolidated real estate ventures | 214,061 | 245,125 | |||||||||
| Other assets, net | 65,441 | 75,053 | |||||||||
| Operating lease right-of-use assets | 23,306 | — | |||||||||
| Total assets | $ | 3,084,245 | $ | 2,729,263 | |||||||
| LIABILITIES AND EQUITY | |||||||||||
| Liabilities | |||||||||||
| Debt financing | $ | 1,534,047 | $ | 1,278,102 | |||||||
| Accounts payable and accrued liabilities | 57,909 | 33,130 | |||||||||
| Operating lease liabilities | 24,665 | — | |||||||||
| Deferred revenue | 15,523 | 15,732 | |||||||||
| Total liabilities | 1,632,144 | 1,326,964 | |||||||||
| Equity | |||||||||||
Preferred shares of beneficial interest, par value $0.01 per share. 50,000,000 authorized, 8,727,119 and 6,900,000 issued and outstanding at December 31, 2019 and 2018, respectively, at liquidation preference |
218,178 | 172,500 | |||||||||
Common shares of beneficial interest, par value $0.01 per share. 250,000,000 shares authorized, 59,659,108 and 56,654,009 shares issued and outstanding at December 31, 2019 and 2018, respectively |
597 | 567 | |||||||||
| Additional paid-in capital | 905,763 | 844,276 | |||||||||
| Distributions in excess of earnings | (197,075) | (114,122) | |||||||||
| Accumulated other comprehensive (loss) income | (7,833) | 13,618 | |||||||||
| Total shareholders' equity | 919,630 | 916,839 | |||||||||
| Noncontrolling interests | 532,471 | 485,460 | |||||||||
| Total equity | 1,452,101 | 1,402,299 | |||||||||
| Total liabilities and equity | $ | 3,084,245 | $ | 2,729,263 | |||||||
8
| Supplemental Schedule 1 | |||||||||||||||||||||||
| Funds From Operations and Core Funds From Operations | |||||||||||||||||||||||
| (in thousands, except per share and unit amounts) (unaudited) | |||||||||||||||||||||||
| Reconciliation of Net Income to FFO and Core FFO | |||||||||||||||||||||||
| Three Months Ended December 31, | Year Ended December 31, | ||||||||||||||||||||||
| 2019 | 2018 | 2019 | 2018 | ||||||||||||||||||||
| Net income | $ | 18,826 | $ | 14,483 | $ | 66,013 | $ | 56,326 | |||||||||||||||
| Add (subtract): | |||||||||||||||||||||||
| Real estate depreciation and amortization | 27,019 | 22,606 | 103,835 | 87,938 | |||||||||||||||||||
Company's share of unconsolidated real estate venture real estate depreciation and amortization |
3,763 | 5,524 | 19,889 | 10,233 | |||||||||||||||||||
Gain on sale of self storage properties |
— | — | (2,814) | (391) | |||||||||||||||||||
Company's share of unconsolidated real estate venture loss on sale of properties |
— | — | 202 | 205 | |||||||||||||||||||
Mark-to-market changes in value on equity securities |
(610) | — | (610) | — | |||||||||||||||||||
Distributions to preferred shareholders and unitholders |
(3,514) | (2,716) | (13,243) | (10,822) | |||||||||||||||||||
FFO attributable to subordinated performance unitholders(1)
|
(9,266) | (7,696) | (34,121) | (27,111) | |||||||||||||||||||
FFO attributable to common shareholders, OP unitholders, and LTIP unitholders |
36,218 | 32,201 | 139,151 | 116,378 | |||||||||||||||||||
| Add: | |||||||||||||||||||||||
| Acquisition costs | 534 | 192 | 1,317 | 663 | |||||||||||||||||||
Core FFO attributable to common shareholders, OP unitholders, and LTIP unitholders |
$ | 36,752 | $ | 32,393 | $ | 140,468 | $ | 117,041 | |||||||||||||||
Weighted average shares and units outstanding - FFO and Core FFO:(2)
|
|||||||||||||||||||||||
| Weighted average shares outstanding - basic | 59,316 | 56,571 | 58,208 | 53,293 | |||||||||||||||||||
| Weighted average restricted common shares outstanding | 26 | 28 | 28 | 29 | |||||||||||||||||||
Weighted average OP units outstanding |
30,457 | 28,881 | 30,277 | 28,977 | |||||||||||||||||||
Weighted average DownREIT OP unit equivalents outstanding |
1,848 | 1,835 | 1,848 | 1,835 | |||||||||||||||||||
Weighted average LTIP units outstanding |
525 | 708 | 585 | 694 | |||||||||||||||||||
Total weighted average shares and units outstanding - FFO and Core FFO |
92,172 | 88,023 | 90,946 | 84,828 | |||||||||||||||||||
| FFO per share and unit | $ | 0.39 | $ | 0.37 | $ | 1.53 | $ | 1.37 | |||||||||||||||
| Core FFO per share and unit | $ | 0.40 | $ | 0.37 | $ | 1.54 | $ | 1.38 | |||||||||||||||
(1) Amounts represent distributions declared for subordinated performance unitholders and DownREIT subordinated performance unitholders for the periods presented. |
|||||||||||||||||||||||
(2) NSA combines OP units and DownREIT OP units with common shares because, after the applicable lock-out periods, OP units in the Company's operating partnership are redeemable for cash or, at NSA's option, exchangeable for common shares on a one-for-one basis and DownREIT OP units are also redeemable for cash or, at NSA's option, exchangeable for OP units in the Company's operating partnership on a one-for-one basis, subject to certain adjustments in each case. Subordinated performance units, DownREIT subordinated performance units and LTIP units may also, under certain circumstances, be convertible into or exchangeable for common shares (or other units that are convertible into or exchangeable for common shares). See footnote(3) for additional discussion of subordinated performance units, DownREIT subordinated performance units, and LTIP units in the calculation of FFO and Core FFO per share and unit.
|
|||||||||||||||||||||||
9
| Supplemental Schedule 1 (continued) | |||||||||||||||||||||||
| Funds From Operations and Core Funds From Operations | |||||||||||||||||||||||
| (in thousands, except per share and unit amounts) (unaudited) | |||||||||||||||||||||||
| Reconciliation of Earnings (Loss) Per Share - Diluted to FFO and Core FFO Per Share and Unit | |||||||||||||||||||||||
| Three Months Ended December 31, | Year Ended December 31, | ||||||||||||||||||||||
| 2019 | 2018 | 2019 | 2018 | ||||||||||||||||||||
| Earnings (loss) per share - diluted | $ | 0.13 | $ | (0.16) | $ | (0.15) | $ | 0.07 | |||||||||||||||
Impact of the difference in weighted average number of shares(3)
|
0.03 | 0.06 | 0.05 | (0.03) | |||||||||||||||||||
Impact of GAAP accounting for noncontrolling interests, two-class method and treasury stock method(4)
|
0.01 | 0.24 | 0.69 | 0.49 | |||||||||||||||||||
| Add real estate depreciation and amortization | 0.29 | 0.26 | 1.14 | 1.04 | |||||||||||||||||||
Add Company's share of unconsolidated real estate venture real estate depreciation and amortization |
0.04 | 0.06 | 0.22 | 0.12 | |||||||||||||||||||
| Subtract gain on sale of self storage properties | — | — | (0.03) | — | |||||||||||||||||||
Subtract mark-to-market changes in value on equity securities |
(0.01) | — | (0.01) | — | |||||||||||||||||||
FFO attributable to subordinated performance unitholders |
(0.10) | (0.09) | (0.38) | (0.32) | |||||||||||||||||||
FFO per share and unit |
0.39 | 0.37 | 1.53 | 1.37 | |||||||||||||||||||
Add acquisition costs |
0.01 | — | 0.01 | 0.01 | |||||||||||||||||||
Core FFO per share and unit |
$ | 0.40 | $ | 0.37 | $ | 1.54 | $ | 1.38 | |||||||||||||||
(3) Adjustment accounts for the difference between the weighted average number of shares used to calculate diluted earnings per share and the weighted average number of shares used to calculate FFO and Core FFO per share and unit. Diluted earnings per share is calculated using the two-class method for the company's restricted common shares and the treasury stock method for certain unvested LTIP units, and assumes the conversion of vested LTIP units into OP units on a one-for-one basis and the hypothetical conversion of subordinated performance units, and DownREIT subordinated performance units into OP units, even though such units may only be convertible into OP units (i) after a lock-out period and (ii) upon certain events or conditions. For additional information about the conversion of subordinated performance units and DownREIT subordinated performance units into OP units, see Note 10 to the Company's most recent Annual Report on Form 10-K, filed with the Securities and Exchange Commission. The computation of weighted average shares and units for FFO and Core FFO per share and unit includes all restricted common shares and LTIP units that participate in distributions and excludes all subordinated performance units and DownREIT subordinated performance units because their effect has been accounted for through the allocation of FFO to the related unitholders based on distributions declared. |
|||||||||||||||||||||||
(4) Represents the effect of adjusting the numerator to consolidated net income (loss) prior to GAAP allocations for noncontrolling interests, after deducting preferred share and unit distributions, and before the application of the two-class method and treasury stock method, as described in footnote(3).
|
|||||||||||||||||||||||
10
| Supplemental Schedule 2 | |||||||||||||||||||||||
| Other Non-GAAP Financial Measurements | |||||||||||||||||||||||
| (dollars in thousands) (unaudited) | |||||||||||||||||||||||
| Net Operating Income | |||||||||||||||||||||||
| Three Months Ended December 31, | Year Ended December 31, | ||||||||||||||||||||||
| 2019 | 2018 | 2019 | 2018 | ||||||||||||||||||||
| Net income | $ | 18,826 | $ | 14,483 | $ | 66,013 | $ | 56,326 | |||||||||||||||
| (Subtract) add: | |||||||||||||||||||||||
| Management fees and other revenue | (5,352) | (4,846) | (20,735) | (12,310) | |||||||||||||||||||
| General and administrative expenses | 11,606 | 10,606 | 45,581 | 36,220 | |||||||||||||||||||
| Depreciation and amortization | 27,343 | 22,921 | 105,119 | 89,147 | |||||||||||||||||||
| Interest expense | 14,874 | 11,961 | 56,464 | 42,724 | |||||||||||||||||||
Equity in losses of unconsolidated real estate ventures |
8 | 1,713 | 4,970 | 1,423 | |||||||||||||||||||
| Acquisition costs | 534 | 192 | 1,317 | 663 | |||||||||||||||||||
| Income tax expense | 392 | 349 | 1,351 | 818 | |||||||||||||||||||
| Gain on sale of self storage properties | — | — | (2,814) | (391) | |||||||||||||||||||
| Non-operating (income) expense | (727) | 160 | (452) | 91 | |||||||||||||||||||
Net Operating Income |
$ | 67,504 | $ | 57,539 | $ | 256,814 | $ | 214,711 | |||||||||||||||
| EBITDA and Adjusted EBITDA | |||||||||||||||||||||||
| Three Months Ended December 31, | Year Ended December 31, | ||||||||||||||||||||||
| 2019 | 2018 | 2019 | 2018 | ||||||||||||||||||||
| Net income | $ | 18,826 | $ | 14,483 | $ | 66,013 | $ | 56,326 | |||||||||||||||
| Add: | |||||||||||||||||||||||
| Depreciation and amortization | 27,343 | 22,921 | 105,119 | 89,147 | |||||||||||||||||||
Company's share of unconsolidated real estate venture depreciation and amortization |
3,763 | 5,524 | 19,889 | 10,233 | |||||||||||||||||||
| Interest expense | 14,874 | 11,961 | 56,464 | 42,724 | |||||||||||||||||||
| Income tax expense | 392 | 349 | 1,351 | 818 | |||||||||||||||||||
EBITDA |
65,198 | 55,238 | 248,836 | 199,248 | |||||||||||||||||||
| Add (subtract): | |||||||||||||||||||||||
| Acquisition costs | 534 | 192 | 1,317 | 663 | |||||||||||||||||||
| Gain on sale of self storage properties | — | — | (2,814) | (391) | |||||||||||||||||||
Company's share of unconsolidated real estate venture loss on sale of properties |
— | — | 202 | 205 | |||||||||||||||||||
| Equity-based compensation expense | 1,154 | 1,029 | 4,527 | 3,837 | |||||||||||||||||||
Adjusted EBITDA |
$ | 66,886 | $ | 56,459 | $ | 252,068 | $ | 203,562 | |||||||||||||||
11
| Supplemental Schedule 3 | ||||||||||||||||||||||||||||||||||||||||||||||||||||||||
| Portfolio Summary | ||||||||||||||||||||||||||||||||||||||||||||||||||||||||
| As of December 31, 2019 | ||||||||||||||||||||||||||||||||||||||||||||||||||||||||
| (dollars in thousands) (unaudited) | ||||||||||||||||||||||||||||||||||||||||||||||||||||||||
| Wholly-Owned Store Data by State (Consolidated) | Total Operated Store Data by State (Consolidated & Unconsolidated) | |||||||||||||||||||||||||||||||||||||||||||||||||||||||
| State/Territories | Stores | Units | Rentable Square Feet | Occupancy at Period End | State/Territories | Stores | Units | Rentable Square Feet | Occupancy at Period End | |||||||||||||||||||||||||||||||||||||||||||||||
| California | 83 | 49,618 | 6,226,952 | 88.4 | % | California | 93 | 55,815 | 6,981,331 | 88.3 | % | |||||||||||||||||||||||||||||||||||||||||||||
| Texas | 71 | 29,465 | 4,218,584 | 86.6 | % | Texas | 75 | 31,800 | 4,495,373 | 86.3 | % | |||||||||||||||||||||||||||||||||||||||||||||
| Oregon | 61 | 24,498 | 3,105,199 | 81.1 | % | Florida | 73 | 44,330 | 4,743,130 | 84.7 | % | |||||||||||||||||||||||||||||||||||||||||||||
| Florida | 46 | 28,956 | 3,021,295 | 86.4 | % | Oregon | 61 | 24,498 | 3,105,199 | 81.1 | % | |||||||||||||||||||||||||||||||||||||||||||||
| Georgia | 44 | 19,044 | 2,547,949 | 87.7 | % | Georgia | 55 | 25,185 | 3,420,281 | 87.5 | % | |||||||||||||||||||||||||||||||||||||||||||||
| North Carolina | 33 | 15,377 | 1,885,479 | 90.8 | % | Oklahoma | 36 | 16,093 | 2,196,864 | 88.3 | % | |||||||||||||||||||||||||||||||||||||||||||||
| Arizona | 31 | 16,893 | 1,925,442 | 86.9 | % | Arizona | 33 | 17,902 | 2,035,272 | 86.6 | % | |||||||||||||||||||||||||||||||||||||||||||||
| Oklahoma | 30 | 13,848 | 1,902,842 | 87.5 | % | North Carolina | 33 | 15,377 | 1,885,479 | 90.8 | % | |||||||||||||||||||||||||||||||||||||||||||||
| Louisiana | 26 | 12,336 | 1,538,959 | 84.8 | % | Louisiana | 26 | 12,336 | 1,538,959 | 84.8 | % | |||||||||||||||||||||||||||||||||||||||||||||
| Indiana | 16 | 8,777 | 1,134,820 | 89.6 | % | Michigan | 24 | 15,616 | 1,977,773 | 87.6 | % | |||||||||||||||||||||||||||||||||||||||||||||
| Kansas | 16 | 5,713 | 763,249 | 86.6 | % | Ohio | 22 | 12,429 | 1,526,139 | 86.5 | % | |||||||||||||||||||||||||||||||||||||||||||||
| Washington | 14 | 4,496 | 578,723 | 80.1 | % | New Jersey | 18 | 11,960 | 1,416,962 | 87.5 | % | |||||||||||||||||||||||||||||||||||||||||||||
| Nevada | 13 | 6,678 | 844,811 | 89.4 | % | Nevada | 17 | 8,296 | 1,096,968 | 89.0 | % | |||||||||||||||||||||||||||||||||||||||||||||
| Colorado | 11 | 5,048 | 615,456 | 84.2 | % | Indiana | 16 | 8,777 | 1,134,820 | 89.6 | % | |||||||||||||||||||||||||||||||||||||||||||||
| New Hampshire | 11 | 4,727 | 576,995 | 90.3 | % | Kansas | 16 | 5,713 | 763,249 | 86.6 | % | |||||||||||||||||||||||||||||||||||||||||||||
| Missouri | 9 | 3,859 | 490,023 | 74.7 | % | Alabama | 15 | 6,295 | 937,091 | 85.9 | % | |||||||||||||||||||||||||||||||||||||||||||||
| Ohio | 8 | 3,642 | 461,393 | 88.5 | % | Washington | 14 | 4,496 | 578,723 | 80.1 | % | |||||||||||||||||||||||||||||||||||||||||||||
Other(1)
|
44 | 22,032 | 2,647,238 | 88.2 | % | Massachusetts | 11 | 7,800 | 836,421 | 87.5 | % | |||||||||||||||||||||||||||||||||||||||||||||
Total |
567 | 275,007 | 34,485,409 | 86.8 | % | Colorado | 11 | 5,048 | 615,456 | 84.2 | % | |||||||||||||||||||||||||||||||||||||||||||||
| New Hampshire | 11 | 4,727 | 576,995 | 90.3 | % | |||||||||||||||||||||||||||||||||||||||||||||||||||
Other(2)
|
82 | 43,624 | 5,237,847 | 84.6 | % | |||||||||||||||||||||||||||||||||||||||||||||||||||
Total |
742 | 378,117 | 47,100,332 | 86.4 | % | |||||||||||||||||||||||||||||||||||||||||||||||||||
(1) Other states and territories in NSA's owned portfolio as of December 31, 2019 include Alabama, Idaho, Illinois, Kentucky, Maryland, Massachusetts, Mississippi, New Jersey, New Mexico, Pennsylvania, South Carolina, Virginia and Puerto Rico. |
||||||||||||||||||||
(2) Other states and territories in NSA's operated portfolio as of December 31, 2019 include Delaware, Idaho, Illinois, Kentucky, Maryland, Minnesota, Mississippi, Missouri, New Mexico, New York, Pennsylvania, Rhode Island, South Carolina, Tennessee, Virginia and Puerto Rico. |
||||||||||||||||||||
12
| Supplemental Schedule 3 (continued) | ||||||||||||||||||||||||||||||||||||||||||||
| Portfolio Summary | ||||||||||||||||||||||||||||||||||||||||||||
| (dollars in thousands) (unaudited) | ||||||||||||||||||||||||||||||||||||||||||||
| 2019 Acquisition Activity | ||||||||||||||||||||||||||||||||||||||||||||
|
Self Storage Properties Acquired
During the Quarter Ended:
|
Summary of Investment | |||||||||||||||||||||||||||||||||||||||||||
| Stores | Units | Rentable Square Feet | Cash and Acquisition Costs | Value of OP Equity | Other Liabilities | Total | ||||||||||||||||||||||||||||||||||||||
| March 31, 2019 | 32 | 14,952 | 1,745,495 | $ | 160,531 | $ | 33,356 | $ | 674 | $ | 194,561 | |||||||||||||||||||||||||||||||||
| June 30, 2019 | 24 | 12,327 | 1,762,895 | 168,442 | 15,515 | 1,378 | 185,335 | |||||||||||||||||||||||||||||||||||||
| September 30, 2019 | 6 | 3,193 | 329,002 | 34,624 | 950 | 197 | 35,771 | |||||||||||||||||||||||||||||||||||||
| December 31, 2019 | 7 | 2,488 | 339,906 | 30,004 | 2,005 | 154 | 32,163 | |||||||||||||||||||||||||||||||||||||
Total Acquisitions(3)
|
69 | 32,960 | 4,177,298 | $ | 393,601 | $ | 51,826 | $ | 2,403 | $ | 447,830 | |||||||||||||||||||||||||||||||||
| 2019 Disposition & Divestiture Activity | ||||||||||||||||||||||||||
| Dispositions Closed During the Quarter Ended: | Stores | Units | Rentable Square Feet | Gross Proceeds | ||||||||||||||||||||||
June 30, 2019(4)
|
1 | 453 | 45,273 | $ | 6,500 | |||||||||||||||||||||
Unconsolidated Real Estate Ventures (at 100%)(5)
|
||||||||||||||||||||||||||
March 31, 2019(6)
|
1 | 318 | 40,930 | 4,075 | ||||||||||||||||||||||
Total 2019 Divestitures(5)
|
2 | 771 | 86,203 | $ | 10,575 | |||||||||||||||||||||
(3) NSA acquired self storage properties located in Arizona (2), Florida (12), Georgia (10), Idaho (3), Louisiana (12), Maryland (1), Massachusetts (2), Missouri (2), New Hampshire (1), New Jersey (3), New Mexico (3), Oregon (1), Pennsylvania (6) and Texas (11). |
||||||||||||||||||||
(4) NSA disposed of a self storage property located in Washington during 2019. |
||||||||||||||||||||
(5) Values represent entire unconsolidated real estate ventures at 100%, not NSA's proportionate share. NSA's ownership in each of the unconsolidated real estate ventures is 25%. |
||||||||||||||||||||
(6) The divestiture completed during the quarter ended March 31, 2019 was a sale from one of NSA's unconsolidated real estate ventures into the consolidated portfolio of NSA. |
||||||||||||||||||||
13
| Supplemental Schedule 4 | |||||||||||||||||||||||||||||||||||||||||||||||||||||||||||||||||||||||
| Debt and Equity Capitalization | |||||||||||||||||||||||||||||||||||||||||||||||||||||||||||||||||||||||
| As of December 31, 2019 | |||||||||||||||||||||||||||||||||||||||||||||||||||||||||||||||||||||||
| (unaudited) | |||||||||||||||||||||||||||||||||||||||||||||||||||||||||||||||||||||||
Debt Summary (dollars in thousands)
|
|||||||||||||||||||||||||||||||||||||||||||||||||||||||||||||||||||||||
Effective Interest Rate(1)
|
Basis of Rate | Maturity Date | 2020 | 2021 | 2022 | 2023 | 2024 | 2025 | 2026 | Thereafter | Total | ||||||||||||||||||||||||||||||||||||||||||||||||||||||||||||
| Credit Facility: | |||||||||||||||||||||||||||||||||||||||||||||||||||||||||||||||||||||||
Revolving line of credit |
3.06% |
Variable(2)
|
January 2024 | $ | — | $ | — | $ | — | $ | — | $ | — | $ | — | $ | — | $ | — | $ | — | ||||||||||||||||||||||||||||||||||||||||||||||||||
Term loan - Tranche A |
3.74% | Swapped To Fixed | January 2023 | — | — | — | 125,000 | — | — | — | — | 125,000 | |||||||||||||||||||||||||||||||||||||||||||||||||||||||||||
Term loan - Tranche B |
2.91% | Swapped To Fixed | July 2024 | — | — | — | — | 250,000 | — | — | — | 250,000 | |||||||||||||||||||||||||||||||||||||||||||||||||||||||||||
Term loan - Tranche C |
2.80% | Swapped To Fixed | January 2025 | — | — | — | — | — | 225,000 | — | — | 225,000 | |||||||||||||||||||||||||||||||||||||||||||||||||||||||||||
Term loan - Tranche D |
3.57% | Swapped To Fixed | July 2026 | — | — | — | — | — | — | 175,000 | — | 175,000 | |||||||||||||||||||||||||||||||||||||||||||||||||||||||||||
| Term loan facility - 2023 | 2.83% | Swapped To Fixed | June 2023 | — | — | — | 175,000 | — | — | — | — | 175,000 | |||||||||||||||||||||||||||||||||||||||||||||||||||||||||||
| Term loan facility - 2028 | 4.62% | Swapped To Fixed | December 2028 | — | — | — | — | — | — | — | 75,000 | 75,000 | |||||||||||||||||||||||||||||||||||||||||||||||||||||||||||
| Term loan facility - 2029 | 4.27% | Swapped To Fixed | April 2029 | — | — | — | — | — | — | — | 100,000 | 100,000 | |||||||||||||||||||||||||||||||||||||||||||||||||||||||||||
| 2029 Senior Unsecured Notes | 3.98% | Fixed | August 2029 | — | — | — | — | — | — | — | 100,000 | 100,000 | |||||||||||||||||||||||||||||||||||||||||||||||||||||||||||
| 2031 Senior Unsecured Notes | 4.08% | Fixed | August 2031 | — | — | — | — | — | — | — | 50,000 | 50,000 | |||||||||||||||||||||||||||||||||||||||||||||||||||||||||||
| Fixed rate mortgages payable | 4.16% | Fixed | October 2020 - October 2031 | 35,343 | 4,901 | — | 81,803 | 20,289 | — | — | 121,924 | 264,260 | |||||||||||||||||||||||||||||||||||||||||||||||||||||||||||
Total Principal/Weighted Average |
3.53% | 5.92 years | $ | 35,343 | $ | 4,901 | $ | — | $ | 381,803 | $ | 270,289 | $ | 225,000 | $ | 175,000 | $ | 446,924 | $ | 1,539,260 | |||||||||||||||||||||||||||||||||||||||||||||||||||
Unamortized debt issuance costs and debt premium, net |
(5,213) | ||||||||||||||||||||||||||||||||||||||||||||||||||||||||||||||||||||||
Total Debt |
$ | 1,534,047 | |||||||||||||||||||||||||||||||||||||||||||||||||||||||||||||||||||||
| Debt Ratios | |||||||||||||||||
Covenant |
Amount |
||||||||||||||||
| Net Debt to Annualized Current Quarter Adjusted EBITDA | n/a | 5.7x | |||||||||||||||
Trailing Twelve Month Fixed Charge Coverage Ratio |
> 1.5x | 3.1x | |||||||||||||||
| Total Leverage Ratio | < 60.0% | 41.5% | |||||||||||||||
(1) Effective interest rate incorporates the stated rate plus the impact of interest rate cash flow hedges and discount and premium amortization, if applicable. |
|||||||||||||||||
(2) For the $500 million revolving line of credit, the effective interest rate is calculated based on one month LIBOR plus an applicable margin of 1.30% and excludes fees which range from 0.15% to 0.20% for unused borrowings. |
|||||||||||||||||
14
| Supplemental Schedule 4 (continued) | |||||||||||||||||
| Debt and Equity Capitalization | |||||||||||||||||
| As of December 31, 2019 | |||||||||||||||||
| (unaudited) | |||||||||||||||||
| Preferred Shares and Units | |||||||||||
| Outstanding | |||||||||||
| 6.000% Series A cumulative redeemable preferred shares of beneficial interest | 8,727,119 | ||||||||||
| 6.000% Series A-1 cumulative redeemable preferred units | 642,982 | ||||||||||
| Common Shares and Units | |||||||||||
| Outstanding | If Converted | ||||||||||
| Common shares of beneficial interest | 59,633,329 | 59,633,329 | |||||||||
| Restricted common shares | 25,779 | 25,779 | |||||||||
Total shares outstanding |
59,659,108 | 59,659,108 | |||||||||
| Operating partnership units | 30,188,305 | 30,188,305 | |||||||||
DownREIT operating partnership unit equivalents |
1,848,261 | 1,848,261 | |||||||||
Total operating partnership units |
32,036,566 | 32,036,566 | |||||||||
Long-term incentive plan units(3)
|
519,566 | 519,566 | |||||||||
Total shares and Class A equivalents outstanding |
92,215,240 | 92,215,240 | |||||||||
Subordinated performance units(4)
|
11,014,195 | 16,301,009 | |||||||||
DownREIT subordinated performance unit equivalents(4)
|
4,371,622 | 6,470,001 | |||||||||
Total subordinated partnership units |
15,385,817 | 22,771,010 | |||||||||
Total common shares and units outstanding |
107,601,057 | 114,986,250 | |||||||||
(3) Balances exclude 224,000 long-term incentive plan ("LTIP") units which only vest and participate in dividend distributions upon the future contribution of properties from the PROs. |
|||||||||||
(4) If converted balance assumes that each subordinated performance unit (including each DownREIT subordinated performance unit) is convertible into OP units, notwithstanding the two-year lock-out period on conversions for certain series of subordinated performance units, and that each subordinated performance unit would on average convert on a hypothetical basis into an estimated 1.48 OP units based on historical financial information for the trailing twelve months ended December 31, 2019. The hypothetical conversions are calculated by dividing the average cash available for distribution, or CAD, per subordinated performance unit by 110% of the CAD per OP unit over the same period. The Company anticipates that as CAD grows over time, the conversion ratio will also grow, including to levels that may exceed these amounts. |
|||||||||||
15
| Supplemental Schedule 5 | ||||||||||||||
| Summarized Information for Unconsolidated Real Estate Ventures | ||||||||||||||
| (dollars in thousands) (unaudited) | ||||||||||||||
| Combined Balance Sheet Information | ||||||||||||||
Total Ventures at 100%(1)
|
December 31, 2019 | December 31, 2018 | ||||||||||||
| ASSETS | ||||||||||||||
| Self storage properties, net | $ | 1,835,235 | $ | 1,894,412 | ||||||||||
| Other assets | 22,413 | 50,915 | ||||||||||||
| Total assets | $ | 1,857,648 | $ | 1,945,327 | ||||||||||
| LIABILITIES AND EQUITY | ||||||||||||||
| Debt financing | $ | 989,182 | $ | 956,357 | ||||||||||
| Other liabilities | 20,487 | 16,516 | ||||||||||||
| Equity | 847,979 | 972,454 | ||||||||||||
| Total liabilities and equity | $ | 1,857,648 | $ | 1,945,327 | ||||||||||
| Combined Operating Information | ||||||||||||||||||||||||||
| Three Months Ended December 31, 2019 | Year Ended December 31, 2019 | |||||||||||||||||||||||||
Total Ventures at 100%(1)
|
NSA Proportionate Share (Ventures at 25%)(2)
|
Total Ventures at 100%(1)
|
NSA Proportionate Share (Ventures at 25%)(2)
|
|||||||||||||||||||||||
| Total revenue | $ | 40,574 | $ | 10,144 | $ | 162,827 | $ | 40,707 | ||||||||||||||||||
| Property operating expenses | 12,030 | 3,008 | 49,845 | 12,461 | ||||||||||||||||||||||
| Net operating income | 28,544 | 7,136 | 112,982 | 28,246 | ||||||||||||||||||||||
Supervisory, administrative and other expenses |
(2,709) | (677) | (10,818) | (2,705) | ||||||||||||||||||||||
| Depreciation and amortization | (15,054) | (3,763) | (79,556) | (19,889) | ||||||||||||||||||||||
| Interest expense | (10,041) | (2,510) | (39,936) | (9,984) | ||||||||||||||||||||||
| Loss on sale of self storage properties | — | — | (806) | (202) | ||||||||||||||||||||||
| Acquisition and other expenses | (830) | (208) | (1,971) | (493) | ||||||||||||||||||||||
| Net loss | $ | (90) | $ | (22) | $ | (20,105) | $ | (5,027) | ||||||||||||||||||
| Add (subtract): | ||||||||||||||||||||||||||
Equity in earnings adjustments related to amortization of basis differences |
14 | 57 | ||||||||||||||||||||||||
Company's share of unconsolidated real estate venture real estate depreciation and amortization |
3,763 | 19,889 | ||||||||||||||||||||||||
Company's share of unconsolidated real estate venture loss on sale of properties |
— | 202 | ||||||||||||||||||||||||
Company's share of FFO and Core FFO from unconsolidated real estate ventures |
$ | 3,755 | $ | 15,121 | ||||||||||||||||||||||
(1) Values represent entire unconsolidated real estate ventures at 100%, not NSA's proportionate share. NSA's ownership in each of the unconsolidated real estate ventures is 25%. |
|||||||||||||||||||||||
(2) NSA's proportionate share of its unconsolidated real estate ventures is derived by applying NSA's 25% ownership interest to each line item in the GAAP financial statements of the unconsolidated real estate ventures to calculate NSA's share of that line item. NSA believes this information offers insights into the financial performance of the Company, although the presentation of such information, and its combination with NSA's consolidated results, may not accurately depict the legal and economic implications of holding a noncontrolling interest in the unconsolidated real estate ventures. The operating agreements of the unconsolidated real estate ventures provide for the distribution of net cash flow to the unconsolidated real estate ventures' investors no less than monthly, generally in proportion to the investors’ respective ownership interests, subject to a promoted distribution to NSA upon the achievement of certain performance benchmarks by the non-NSA investor. |
|||||||||||||||||||||||
16
| Supplemental Schedule 6 | |||||||||||||||||||||||||||||||||||||||||||||||||||||||||||||||||||||||||||||
| Same Store Performance Summary By State | |||||||||||||||||||||||||||||||||||||||||||||||||||||||||||||||||||||||||||||
| (dollars in thousands, except per square foot data) (unaudited) | |||||||||||||||||||||||||||||||||||||||||||||||||||||||||||||||||||||||||||||
| Three Months Ended December 31, 2019 compared to Three Months Ended December 31, 2018 | |||||||||||||||||||||||||||||||||||||||||||||||||||||||||||||||||||||||||||||
| Total Revenue | Property Operating Expenses | Net Operating Income | Net Operating Income Margin | ||||||||||||||||||||||||||||||||||||||||||||||||||||||||||||||||||||||||||
| State | Stores | 4Q 2019 | 4Q 2018 | Growth | 4Q 2019 | 4Q 2018 | Growth | 4Q 2019 | 4Q 2018 | Growth | 4Q 2019 | 4Q 2018 | Growth | ||||||||||||||||||||||||||||||||||||||||||||||||||||||||||||||||
| California | 80 | $ | 19,349 | $ | 18,894 | 2.4 | % | $ | 5,132 | $ | 5,091 | 0.8 | % | $ | 14,217 | $ | 13,803 | 3.0 | % | 73.5 | % | 73.1 | % | 0.4 | % | ||||||||||||||||||||||||||||||||||||||||||||||||||||
| Oregon | 58 | 9,527 | 9,448 | 0.8 | % | 2,463 | 2,408 | 2.3 | % | 7,064 | 7,040 | 0.3 | % | 74.1 | % | 74.5 | % | (0.4) | % | ||||||||||||||||||||||||||||||||||||||||||||||||||||||||||
| Texas | 58 | 7,577 | 7,274 | 4.2 | % | 2,644 | 2,553 | 3.6 | % | 4,933 | 4,721 | 4.5 | % | 65.1 | % | 64.9 | % | 0.2 | % | ||||||||||||||||||||||||||||||||||||||||||||||||||||||||||
| Georgia | 33 | 4,369 | 4,121 | 6.0 | % | 1,254 | 1,313 | (4.5) | % | 3,115 | 2,808 | 10.9 | % | 71.3 | % | 68.1 | % | 3.2 | % | ||||||||||||||||||||||||||||||||||||||||||||||||||||||||||
| Oklahoma | 30 | 3,714 | 3,627 | 2.4 | % | 1,121 | 1,058 | 6.0 | % | 2,593 | 2,569 | 0.9 | % | 69.8 | % | 70.8 | % | (1.0) | % | ||||||||||||||||||||||||||||||||||||||||||||||||||||||||||
| North Carolina | 29 | 4,288 | 4,050 | 5.9 | % | 1,157 | 1,414 | (18.2) | % | 3,131 | 2,636 | 18.8 | % | 73.0 | % | 65.1 | % | 7.9 | % | ||||||||||||||||||||||||||||||||||||||||||||||||||||||||||
| Florida | 28 | 6,727 | 6,580 | 2.2 | % | 1,990 | 2,019 | (1.4) | % | 4,737 | 4,561 | 3.9 | % | 70.4 | % | 69.3 | % | 1.1 | % | ||||||||||||||||||||||||||||||||||||||||||||||||||||||||||
| Arizona | 16 | 3,275 | 3,174 | 3.2 | % | 897 | 846 | 6.0 | % | 2,378 | 2,328 | 2.1 | % | 72.6 | % | 73.3 | % | (0.7) | % | ||||||||||||||||||||||||||||||||||||||||||||||||||||||||||
| Indiana | 16 | 2,527 | 2,474 | 2.1 | % | 775 | 799 | (3.0) | % | 1,752 | 1,675 | 4.6 | % | 69.3 | % | 67.7 | % | 1.6 | % | ||||||||||||||||||||||||||||||||||||||||||||||||||||||||||
| Louisiana | 14 | 1,919 | 1,844 | 4.1 | % | 576 | 626 | (8.0) | % | 1,343 | 1,218 | 10.3 | % | 70.0 | % | 66.1 | % | 3.9 | % | ||||||||||||||||||||||||||||||||||||||||||||||||||||||||||
| Washington | 13 | 1,727 | 1,764 | (2.1) | % | 462 | 462 | — | 1,265 | 1,302 | (2.8) | % | 73.2 | % | 73.8 | % | (0.6) | % | |||||||||||||||||||||||||||||||||||||||||||||||||||||||||||
| Nevada | 11 | 2,020 | 1,906 | 6.0 | % | 553 | 531 | 4.1 | % | 1,467 | 1,375 | 6.7 | % | 72.6 | % | 72.1 | % | 0.5 | % | ||||||||||||||||||||||||||||||||||||||||||||||||||||||||||
| Colorado | 11 | 1,723 | 1,764 | (2.3) | % | 595 | 553 | 7.6 | % | 1,128 | 1,211 | (6.9) | % | 65.5 | % | 68.7 | % | (3.2) | % | ||||||||||||||||||||||||||||||||||||||||||||||||||||||||||
| New Hampshire | 10 | 1,581 | 1,538 | 2.8 | % | 534 | 522 | 2.3 | % | 1,047 | 1,016 | 3.1 | % | 66.2 | % | 66.1 | % | 0.1 | % | ||||||||||||||||||||||||||||||||||||||||||||||||||||||||||
Other(1)
|
32 | 4,469 | 4,317 | 3.5 | % | 1,610 | 1,510 | 6.6 | % | 2,859 | 2,807 | 1.9 | % | 64.0 | % | 65.0 | % | (1.0) | % | ||||||||||||||||||||||||||||||||||||||||||||||||||||||||||
| Total/Weighted Average | 439 | $ | 74,792 | $ | 72,775 | 2.8 | % | $ | 21,763 | $ | 21,705 | 0.3 | % | $ | 53,029 | $ | 51,070 | 3.8 | % | 70.9 | % | 70.2 | % | 0.7 | % | ||||||||||||||||||||||||||||||||||||||||||||||||||||
(1) Other states in NSA's same store portfolio include Alabama, Illinois, Kansas, Kentucky, Maryland, Massachusetts, Mississippi, Missouri, New Mexico, Ohio, South Carolina and Virginia. |
||||||||||||||||||||
17
| Supplemental Schedule 6 (continued) | ||||||||||||||||||||||||||||||||||||||||||||||||||||||||||||||
| Same Store Performance Summary By State | ||||||||||||||||||||||||||||||||||||||||||||||||||||||||||||||
| (dollars in thousands, except per square foot data) (unaudited) | ||||||||||||||||||||||||||||||||||||||||||||||||||||||||||||||
| Three Months Ended December 31, 2019 compared to Three Months Ended December 31, 2018 | ||||||||||||||||||||||||||||||||||||||||||||||||||||||||||||||
| Rentable Square Feet | Occupancy at Period End | Average Occupancy | Average Annualized Rental Revenue per Occupied Square Foot | |||||||||||||||||||||||||||||||||||||||||||||||||||||||||||
| State | Units | 4Q 2019 | 4Q 2018 | Growth | 4Q 2019 | 4Q 2018 | Growth | 4Q 2019 | 4Q 2018 | Growth | ||||||||||||||||||||||||||||||||||||||||||||||||||||
| California | 48,079 | 6,074,479 | 88.8 | % | 89.3 | % | (0.5) | % | 89.3 | % | 90.0 | % | (0.7) | % | $ | 13.65 | $ | 13.25 | 3.0 | % | ||||||||||||||||||||||||||||||||||||||||||
| Oregon | 23,660 | 2,989,284 | 81.1 | % | 82.4 | % | (1.3) | % | 82.8 | % | 84.0 | % | (1.2) | % | 15.09 | 14.75 | 2.3 | % | ||||||||||||||||||||||||||||||||||||||||||||
| Texas | 23,219 | 3,295,081 | 88.3 | % | 87.9 | % | 0.4 | % | 89.1 | % | 88.5 | % | 0.6 | % | 10.05 | 9.73 | 3.3 | % | ||||||||||||||||||||||||||||||||||||||||||||
| Georgia | 13,561 | 1,842,440 | 89.1 | % | 87.9 | % | 1.2 | % | 90.3 | % | 88.0 | % | 2.3 | % | 10.16 | 9.78 | 3.9 | % | ||||||||||||||||||||||||||||||||||||||||||||
| Oklahoma | 13,848 | 1,902,842 | 87.5 | % | 85.1 | % | 2.4 | % | 88.2 | % | 85.4 | % | 2.8 | % | 8.61 | 8.67 | (0.7) | % | ||||||||||||||||||||||||||||||||||||||||||||
| North Carolina | 13,081 | 1,599,504 | 91.1 | % | 90.9 | % | 0.2 | % | 92.6 | % | 91.3 | % | 1.3 | % | 11.16 | 10.67 | 4.6 | % | ||||||||||||||||||||||||||||||||||||||||||||
| Florida | 18,861 | 2,001,586 | 86.6 | % | 87.4 | % | (0.8) | % | 87.3 | % | 88.0 | % | (0.7) | % | 14.80 | 14.54 | 1.8 | % | ||||||||||||||||||||||||||||||||||||||||||||
| Arizona | 9,138 | 1,067,641 | 86.3 | % | 85.7 | % | 0.6 | % | 87.4 | % | 86.9 | % | 0.5 | % | 13.57 | 13.25 | 2.4 | % | ||||||||||||||||||||||||||||||||||||||||||||
| Indiana | 8,777 | 1,134,820 | 89.6 | % | 88.8 | % | 0.8 | % | 90.7 | % | 89.9 | % | 0.8 | % | 9.57 | 9.43 | 1.5 | % | ||||||||||||||||||||||||||||||||||||||||||||
| Louisiana | 6,312 | 857,924 | 86.2 | % | 83.0 | % | 3.2 | % | 86.3 | % | 83.0 | % | 3.3 | % | 10.19 | 10.15 | 0.4 | % | ||||||||||||||||||||||||||||||||||||||||||||
| Washington | 4,284 | 554,988 | 80.0 | % | 82.9 | % | (2.9) | % | 81.3 | % | 85.1 | % | (3.8) | % | 14.99 | 14.66 | 2.3 | % | ||||||||||||||||||||||||||||||||||||||||||||
| Nevada | 5,825 | 736,215 | 89.9 | % | 91.9 | % | (2.0) | % | 90.1 | % | 93.0 | % | (2.9) | % | 11.63 | 10.76 | 8.1 | % | ||||||||||||||||||||||||||||||||||||||||||||
| Colorado | 5,048 | 615,456 | 84.2 | % | 86.8 | % | (2.6) | % | 86.4 | % | 88.5 | % | (2.1) | % | 12.67 | 12.67 | — | |||||||||||||||||||||||||||||||||||||||||||||
| New Hampshire | 4,249 | 515,720 | 90.3 | % | 92.7 | % | (2.4) | % | 89.9 | % | 92.2 | % | (2.3) | % | 13.25 | 12.75 | 3.9 | % | ||||||||||||||||||||||||||||||||||||||||||||
Other(1)
|
13,414 | 1,821,637 | 87.1 | % | 88.0 | % | (0.9) | % | 88.3 | % | 89.3 | % | (1.0) | % | 10.66 | 10.20 | 4.5 | % | ||||||||||||||||||||||||||||||||||||||||||||
| Total/Weighted Average | 211,356 | 27,009,617 | 87.3 | % | 87.4 | % | (0.1) | % | 88.2 | % | 88.2 | % | — | $ | 12.14 | $ | 11.83 | 2.6 | % | |||||||||||||||||||||||||||||||||||||||||||
| (1) Other states in NSA's same store portfolio include Alabama, Illinois, Kansas, Kentucky, Maryland, Massachusetts, Mississippi, Missouri, New Mexico, Ohio, South Carolina and Virginia. | ||||||||||||||||||||
18
| Supplemental Schedule 6 (continued) | |||||||||||||||||||||||||||||||||||||||||||||||||||||||||||||||||||||||||||||
| Same Store Performance Summary By State | |||||||||||||||||||||||||||||||||||||||||||||||||||||||||||||||||||||||||||||
| (dollars in thousands, except per square foot data) (unaudited) | |||||||||||||||||||||||||||||||||||||||||||||||||||||||||||||||||||||||||||||
| Year Ended December 31, 2019 compared to Year Ended December 31, 2018 | |||||||||||||||||||||||||||||||||||||||||||||||||||||||||||||||||||||||||||||
| Total Revenue | Property Operating Expenses | Net Operating Income | Net Operating Income Margin | ||||||||||||||||||||||||||||||||||||||||||||||||||||||||||||||||||||||||||
| State | Stores | YTD 2019 | YTD 2018 | Growth | YTD 2019 | YTD 2018 | Growth | YTD 2019 | YTD 2018 | Growth | YTD 2019 | YTD 2018 | Growth | ||||||||||||||||||||||||||||||||||||||||||||||||||||||||||||||||
| California | 80 | $ | 76,743 | $ | 73,865 | 3.9 | % | $ | 20,613 | $ | 20,457 | 0.8 | % | $ | 56,130 | $ | 53,408 | 5.1 | % | 73.1 | % | 72.3 | % | 0.8 | % | ||||||||||||||||||||||||||||||||||||||||||||||||||||
| Oregon | 58 | 38,383 | 37,981 | 1.1 | % | 9,949 | 9,781 | 1.7 | % | 28,434 | 28,200 | 0.8 | % | 74.1 | % | 74.2 | % | (0.1) | % | ||||||||||||||||||||||||||||||||||||||||||||||||||||||||||
| Texas | 58 | 29,857 | 28,661 | 4.2 | % | 10,972 | 10,684 | 2.7 | % | 18,885 | 17,977 | 5.1 | % | 63.3 | % | 62.7 | % | 0.6 | % | ||||||||||||||||||||||||||||||||||||||||||||||||||||||||||
| Georgia | 33 | 17,125 | 15,786 | 8.5 | % | 5,401 | 5,122 | 5.4 | % | 11,724 | 10,664 | 9.9 | % | 68.5 | % | 67.6 | % | 0.9 | % | ||||||||||||||||||||||||||||||||||||||||||||||||||||||||||
| Oklahoma | 30 | 14,739 | 14,345 | 2.7 | % | 4,633 | 4,453 | 4.0 | % | 10,106 | 9,892 | 2.2 | % | 68.6 | % | 69.0 | % | (0.4) | % | ||||||||||||||||||||||||||||||||||||||||||||||||||||||||||
| North Carolina | 29 | 16,888 | 15,994 | 5.6 | % | 4,984 | 4,978 | 0.1 | % | 11,904 | 11,016 | 8.1 | % | 70.5 | % | 68.9 | % | 1.6 | % | ||||||||||||||||||||||||||||||||||||||||||||||||||||||||||
| Florida | 28 | 26,612 | 25,860 | 2.9 | % | 8,011 | 8,072 | (0.8) | % | 18,601 | 17,788 | 4.6 | % | 69.9 | % | 68.8 | % | 1.1 | % | ||||||||||||||||||||||||||||||||||||||||||||||||||||||||||
| Arizona | 16 | 12,956 | 12,467 | 3.9 | % | 3,656 | 3,493 | 4.7 | % | 9,300 | 8,974 | 3.6 | % | 71.8 | % | 72.0 | % | (0.2) | % | ||||||||||||||||||||||||||||||||||||||||||||||||||||||||||
| Indiana | 16 | 10,152 | 9,674 | 4.9 | % | 3,054 | 3,113 | (1.9) | % | 7,098 | 6,561 | 8.2 | % | 69.9 | % | 67.8 | % | 2.1 | % | ||||||||||||||||||||||||||||||||||||||||||||||||||||||||||
| Louisiana | 14 | 7,548 | 7,334 | 2.9 | % | 2,586 | 2,581 | 0.2 | % | 4,962 | 4,753 | 4.4 | % | 65.7 | % | 64.8 | % | 0.9 | % | ||||||||||||||||||||||||||||||||||||||||||||||||||||||||||
| Washington | 13 | 7,064 | 7,074 | (0.1) | % | 1,889 | 1,929 | (2.1) | % | 5,175 | 5,145 | 0.6 | % | 73.3 | % | 72.7 | % | 0.6 | % | ||||||||||||||||||||||||||||||||||||||||||||||||||||||||||
| Nevada | 11 | 7,939 | 7,265 | 9.3 | % | 2,199 | 2,231 | (1.4) | % | 5,740 | 5,034 | 14.0 | % | 72.3 | % | 69.3 | % | 3.0 | % | ||||||||||||||||||||||||||||||||||||||||||||||||||||||||||
| Colorado | 11 | 7,020 | 6,949 | 1.0 | % | 2,377 | 2,235 | 6.4 | % | 4,643 | 4,714 | (1.5) | % | 66.1 | % | 67.8 | % | (1.7) | % | ||||||||||||||||||||||||||||||||||||||||||||||||||||||||||
| New Hampshire | 10 | 6,359 | 5,990 | 6.2 | % | 2,098 | 1,981 | 5.9 | % | 4,261 | 4,009 | 6.3 | % | 67.0 | % | 66.9 | % | 0.1 | % | ||||||||||||||||||||||||||||||||||||||||||||||||||||||||||
Other(1)
|
32 | 17,792 | 16,575 | 7.3 | % | 6,272 | 6,152 | 2.0 | % | 11,520 | 10,423 | 10.5 | % | 64.7 | % | 62.9 | % | 1.8 | % | ||||||||||||||||||||||||||||||||||||||||||||||||||||||||||
| Total/Weighted Average | 439 | $ | 297,177 | $ | 285,820 | 4.0 | % | $ | 88,694 | $ | 87,262 | 1.6 | % | $ | 208,483 | $ | 198,558 | 5.0 | % | 70.2 | % | 69.5 | % | 0.7 | % | ||||||||||||||||||||||||||||||||||||||||||||||||||||
| (1) Other states in NSA's same store portfolio include Alabama, Illinois, Kansas, Kentucky, Maryland, Massachusetts, Mississippi, Missouri, New Mexico, Ohio, South Carolina and Virginia. | ||||||||||||||||||||
19
| Supplemental Schedule 6 (continued) | ||||||||||||||||||||||||||||||||||||||||||||||||||||||||||||||
| Same Store Performance Summary By State | ||||||||||||||||||||||||||||||||||||||||||||||||||||||||||||||
| (dollars in thousands, except per square foot data) (unaudited) | ||||||||||||||||||||||||||||||||||||||||||||||||||||||||||||||
| Year Ended December 31, 2019 compared to Year Ended December 31, 2018 | ||||||||||||||||||||||||||||||||||||||||||||||||||||||||||||||
| Rentable Square Feet | Occupancy at Period End | Average Occupancy | Average Annualized Rental Revenue per Occupied Square Foot | |||||||||||||||||||||||||||||||||||||||||||||||||||||||||||
| State | Units | YTD 2019 | YTD 2018 | Growth | YTD 2019 | YTD 2018 | Growth | YTD 2019 | YTD 2018 | Growth | ||||||||||||||||||||||||||||||||||||||||||||||||||||
| California | 48,079 | 6,074,479 | 88.8 | % | 89.3 | % | (0.5) | % | 90.3 | % | 91.2 | % | (0.9) | % | $ | 13.38 | $ | 12.76 | 4.9 | % | ||||||||||||||||||||||||||||||||||||||||||
| Oregon | 23,660 | 2,989,284 | 81.1 | % | 82.4 | % | (1.3) | % | 84.0 | % | 85.6 | % | (1.6) | % | 14.97 | 14.55 | 2.9 | % | ||||||||||||||||||||||||||||||||||||||||||||
| Texas | 23,219 | 3,295,081 | 88.3 | % | 87.9 | % | 0.4 | % | 89.3 | % | 88.8 | % | 0.5 | % | 9.86 | 9.54 | 3.4 | % | ||||||||||||||||||||||||||||||||||||||||||||
| Georgia | 13,561 | 1,842,440 | 89.1 | % | 87.9 | % | 1.2 | % | 90.0 | % | 87.4 | % | 2.6 | % | 9.97 | 9.48 | 5.2 | % | ||||||||||||||||||||||||||||||||||||||||||||
| Oklahoma | 13,848 | 1,902,842 | 87.5 | % | 85.1 | % | 2.4 | % | 87.5 | % | 85.0 | % | 2.5 | % | 8.59 | 8.62 | (0.3) | % | ||||||||||||||||||||||||||||||||||||||||||||
| North Carolina | 13,081 | 1,599,504 | 91.1 | % | 90.9 | % | 0.2 | % | 92.8 | % | 90.7 | % | 2.1 | % | 10.92 | 10.57 | 3.3 | % | ||||||||||||||||||||||||||||||||||||||||||||
| Florida | 18,861 | 2,001,586 | 86.6 | % | 87.4 | % | (0.8) | % | 87.6 | % | 87.9 | % | (0.3) | % | 14.64 | 14.40 | 1.7 | % | ||||||||||||||||||||||||||||||||||||||||||||
| Arizona | 9,138 | 1,067,641 | 86.3 | % | 85.7 | % | 0.6 | % | 87.8 | % | 87.9 | % | (0.1) | % | 13.36 | 12.87 | 3.8 | % | ||||||||||||||||||||||||||||||||||||||||||||
| Indiana | 8,777 | 1,134,820 | 89.6 | % | 88.8 | % | 0.8 | % | 90.4 | % | 88.1 | % | 2.3 | % | 9.63 | 9.40 | 2.4 | % | ||||||||||||||||||||||||||||||||||||||||||||
| Louisiana | 6,312 | 857,924 | 86.2 | % | 83.0 | % | 3.2 | % | 85.4 | % | 83.7 | % | 1.7 | % | 10.10 | 10.00 | 1.0 | % | ||||||||||||||||||||||||||||||||||||||||||||
| Washington | 4,284 | 554,988 | 80.0 | % | 82.9 | % | (2.9) | % | 83.6 | % | 87.2 | % | (3.6) | % | 14.93 | 14.36 | 4.0 | % | ||||||||||||||||||||||||||||||||||||||||||||
| Nevada | 5,825 | 736,215 | 89.9 | % | 91.9 | % | (2.0) | % | 90.9 | % | 93.2 | % | (2.3) | % | 11.36 | 10.26 | 10.7 | % | ||||||||||||||||||||||||||||||||||||||||||||
| Colorado | 5,048 | 615,456 | 84.2 | % | 86.8 | % | (2.6) | % | 88.7 | % | 90.0 | % | (1.3) | % | 12.57 | 12.25 | 2.6 | % | ||||||||||||||||||||||||||||||||||||||||||||
| New Hampshire | 4,249 | 515,720 | 90.3 | % | 92.7 | % | (2.4) | % | 91.3 | % | 90.8 | % | 0.5 | % | 13.22 | 12.61 | 4.8 | % | ||||||||||||||||||||||||||||||||||||||||||||
Other(1)
|
13,414 | 1,821,637 | 87.1 | % | 88.0 | % | (0.9) | % | 89.1 | % | 87.5 | % | 1.6 | % | 10.52 | 9.99 | 5.3 | % | ||||||||||||||||||||||||||||||||||||||||||||
| Total/Weighted Average | 211,356 | 27,009,617 | 87.3 | % | 87.4 | % | (0.1) | % | 88.8 | % | 88.5 | % | 0.3 | % | $ | 11.98 | $ | 11.58 | 3.5 | % | ||||||||||||||||||||||||||||||||||||||||||
| (1) Other states in NSA's same store portfolio include Alabama, Illinois, Kansas, Kentucky, Maryland, Massachusetts, Mississippi, Missouri, New Mexico, Ohio, South Carolina and Virginia. | ||||||||||||||||||||
20
| Supplemental Schedule 7 | |||||||||||||||||||||||||||||||||||||||||||||||||||||||||||||||||||||||||||||
Same Store Performance Summary By MSA(1)
|
|||||||||||||||||||||||||||||||||||||||||||||||||||||||||||||||||||||||||||||
| (dollars in thousands, except per square foot data) (unaudited) | |||||||||||||||||||||||||||||||||||||||||||||||||||||||||||||||||||||||||||||
| Three Months Ended December 31, 2019 compared to Three Months Ended December 31, 2018 | |||||||||||||||||||||||||||||||||||||||||||||||||||||||||||||||||||||||||||||
| Total Revenue | Property Operating Expenses | Net Operating Income | Net Operating Income Margin | ||||||||||||||||||||||||||||||||||||||||||||||||||||||||||||||||||||||||||
MSA(1)
|
Stores | 4Q 2019 | 4Q 2018 | Growth | 4Q 2019 | 4Q 2018 | Growth | 4Q 2019 | 4Q 2018 | Growth | 4Q 2019 | 4Q 2018 | Growth | ||||||||||||||||||||||||||||||||||||||||||||||||||||||||||||||||
| Riverside-San Bernardino-Ontario, CA | 46 | $ | 9,654 | $ | 9,370 | 3.0 | % | $ | 2,378 | $ | 2,418 | (1.7) | % | $ | 7,276 | $ | 6,952 | 4.7 | % | 75.4 | % | 74.2 | % | 1.2 | % | ||||||||||||||||||||||||||||||||||||||||||||||||||||
| Portland-Vancouver-Hillsboro, OR-WA | 45 | 7,535 | 7,509 | 0.3 | % | 1,919 | 1,896 | 1.2 | % | 5,616 | 5,613 | 0.1 | % | 74.5 | % | 74.8 | % | (0.3) | % | ||||||||||||||||||||||||||||||||||||||||||||||||||||||||||
| Atlanta-Sandy Springs-Roswell, GA | 25 | 3,783 | 3,564 | 6.1 | % | 1,029 | 1,095 | (6.0) | % | 2,754 | 2,469 | 11.5 | % | 72.8 | % | 69.3 | % | 3.5 | % | ||||||||||||||||||||||||||||||||||||||||||||||||||||||||||
| Dallas-Fort Worth-Arlington, TX | 17 | 2,274 | 2,222 | 2.3 | % | 843 | 811 | 3.9 | % | 1,431 | 1,411 | 1.4 | % | 62.9 | % | 63.5 | % | (0.6) | % | ||||||||||||||||||||||||||||||||||||||||||||||||||||||||||
| Oklahoma City, OK | 17 | 2,053 | 1,997 | 2.8 | % | 639 | 602 | 6.1 | % | 1,414 | 1,395 | 1.4 | % | 68.9 | % | 69.9 | % | (1.0) | % | ||||||||||||||||||||||||||||||||||||||||||||||||||||||||||
| Indianapolis-Carmel-Anderson, IN | 16 | 2,527 | 2,475 | 2.1 | % | 775 | 799 | (3.0) | % | 1,752 | 1,676 | 4.5 | % | 69.3 | % | 67.7 | % | 1.6 | % | ||||||||||||||||||||||||||||||||||||||||||||||||||||||||||
| Los Angeles-Long Beach-Anaheim, CA | 14 | 4,930 | 4,921 | 0.2 | % | 1,352 | 1,285 | 5.2 | % | 3,578 | 3,636 | (1.6) | % | 72.6 | % | 73.9 | % | (1.3) | % | ||||||||||||||||||||||||||||||||||||||||||||||||||||||||||
| Tulsa, OK | 13 | 1,662 | 1,630 | 2.0 | % | 482 | 456 | 5.7 | % | 1,180 | 1,174 | 0.5 | % | 71.0 | % | 72.0 | % | (1.0) | % | ||||||||||||||||||||||||||||||||||||||||||||||||||||||||||
| North Port-Sarasota-Bradenton, FL | 12 | 2,744 | 2,644 | 3.8 | % | 801 | 868 | (7.7) | % | 1,943 | 1,776 | 9.4 | % | 70.8 | % | 67.2 | % | 3.6 | % | ||||||||||||||||||||||||||||||||||||||||||||||||||||||||||
| Phoenix-Mesa-Scottsdale, AZ | 12 | 2,602 | 2,553 | 1.9 | % | 718 | 673 | 6.7 | % | 1,884 | 1,880 | 0.2 | % | 72.4 | % | 73.6 | % | (1.2) | % | ||||||||||||||||||||||||||||||||||||||||||||||||||||||||||
| Las Vegas-Henderson-Paradise, NV | 11 | 2,020 | 1,906 | 6.0 | % | 553 | 531 | 4.1 | % | 1,467 | 1,375 | 6.7 | % | 72.6 | % | 72.1 | % | 0.5 | % | ||||||||||||||||||||||||||||||||||||||||||||||||||||||||||
| Other MSAs | 211 | 33,008 | 31,984 | 3.2 | % | 10,274 | 10,271 | — | 22,734 | 21,713 | 4.7 | % | 68.9 | % | 67.9 | % | 1.0 | % | |||||||||||||||||||||||||||||||||||||||||||||||||||||||||||
| Total/Weighted Average | 439 | $ | 74,792 | $ | 72,775 | 2.8 | % | $ | 21,763 | $ | 21,705 | 0.3 | % | $ | 53,029 | $ | 51,070 | 3.8 | % | 70.9 | % | 70.2 | % | 0.7 | % | ||||||||||||||||||||||||||||||||||||||||||||||||||||
(1) MSA (Metropolitan Statistical Area) as defined by the United States Census Bureau. |
||||||||||||||||||||
21
| Supplemental Schedule 7 (continued) | ||||||||||||||||||||||||||||||||||||||||||||||||||||||||||||||
Same Store Performance Summary By MSA(1)
|
||||||||||||||||||||||||||||||||||||||||||||||||||||||||||||||
| (dollars in thousands, except per square foot data) (unaudited) | ||||||||||||||||||||||||||||||||||||||||||||||||||||||||||||||
| Three Months Ended December 31, 2019 compared to Three Months Ended December 31, 2018 | ||||||||||||||||||||||||||||||||||||||||||||||||||||||||||||||
| Rentable Square Feet | Occupancy at Period End | Average Occupancy | Average Annualized Rental Revenue per Occupied Square Foot | |||||||||||||||||||||||||||||||||||||||||||||||||||||||||||
MSA(1)
|
Units | 4Q 2019 | 4Q 2018 | Growth | 4Q 2019 | 4Q 2018 | Growth | 4Q 2019 | 4Q 2018 | Growth | ||||||||||||||||||||||||||||||||||||||||||||||||||||
| Riverside-San Bernardino-Ontario, CA | 24,873 | 3,343,166 | 89.6 | % | 89.2 | % | 0.4 | % | 89.7 | % | 90.1 | % | (0.4) | % | $ | 12.24 | $ | 11.85 | 3.3 | % | ||||||||||||||||||||||||||||||||||||||||||
| Portland-Vancouver-Hillsboro, OR-WA | 17,618 | 2,152,373 | 81.2 | % | 82.8 | % | (1.6) | % | 82.7 | % | 84.1 | % | (1.4) | % | 16.63 | 16.28 | 2.1 | % | ||||||||||||||||||||||||||||||||||||||||||||
| Atlanta-Sandy Springs-Roswell, GA | 11,493 | 1,577,880 | 88.8 | % | 87.9 | % | 0.9 | % | 90.3 | % | 87.9 | % | 2.4 | % | 10.29 | 9.93 | 3.6 | % | ||||||||||||||||||||||||||||||||||||||||||||
| Dallas-Fort Worth-Arlington, TX | 6,423 | 858,292 | 87.4 | % | 86.0 | % | 1.4 | % | 87.8 | % | 87.2 | % | 0.6 | % | 11.71 | 11.57 | 1.2 | % | ||||||||||||||||||||||||||||||||||||||||||||
| Oklahoma City, OK | 7,723 | 1,087,927 | 87.8 | % | 84.1 | % | 3.7 | % | 88.4 | % | 84.3 | % | 4.1 | % | 8.30 | 8.48 | (2.1) | % | ||||||||||||||||||||||||||||||||||||||||||||
| Indianapolis-Carmel-Anderson, IN | 8,777 | 1,134,820 | 89.6 | % | 88.8 | % | 0.8 | % | 90.7 | % | 89.9 | % | 0.8 | % | 9.57 | 9.43 | 1.5 | % | ||||||||||||||||||||||||||||||||||||||||||||
| Los Angeles-Long Beach-Anaheim, CA | 9,743 | 1,063,014 | 86.1 | % | 88.2 | % | (2.1) | % | 86.2 | % | 88.4 | % | (2.2) | % | 20.67 | 20.10 | 2.8 | % | ||||||||||||||||||||||||||||||||||||||||||||
| Tulsa, OK | 6,125 | 814,915 | 87.2 | % | 86.4 | % | 0.8 | % | 87.8 | % | 86.9 | % | 0.9 | % | 9.02 | 8.92 | 1.1 | % | ||||||||||||||||||||||||||||||||||||||||||||
| North Port-Sarasota-Bradenton, FL | 7,778 | 756,319 | 84.4 | % | 84.5 | % | (0.1) | % | 84.9 | % | 85.0 | % | (0.1) | % | 16.43 | 16.01 | 2.6 | % | ||||||||||||||||||||||||||||||||||||||||||||
| Phoenix-Mesa-Scottsdale, AZ | 7,407 | 833,199 | 85.5 | % | 84.3 | % | 1.2 | % | 86.2 | % | 85.4 | % | 0.8 | % | 13.96 | 13.85 | 0.8 | % | ||||||||||||||||||||||||||||||||||||||||||||
| Las Vegas-Henderson-Paradise, NV | 5,825 | 736,215 | 89.9 | % | 91.9 | % | (2.0) | % | 90.1 | % | 93.0 | % | (2.9) | % | 11.63 | 10.76 | 8.1 | % | ||||||||||||||||||||||||||||||||||||||||||||
| Other MSAs | 97,571 | 12,651,497 | 87.5 | % | 88.1 | % | (0.6) | % | 88.7 | % | 88.9 | % | (0.2) | % | 11.40 | 11.04 | 3.3 | % | ||||||||||||||||||||||||||||||||||||||||||||
| Total/Weighted Average | 211,356 | 27,009,617 | 87.3 | % | 87.4 | % | (0.1) | % | 88.2 | % | 88.2 | % | — | $ | 12.14 | $ | 11.83 | 2.6 | % | |||||||||||||||||||||||||||||||||||||||||||
(1) MSA (Metropolitan Statistical Area) as defined by the United States Census Bureau. |
||||||||||||||||||||
22
| Supplemental Schedule 7 (continued) | |||||||||||||||||||||||||||||||||||||||||||||||||||||||||||||||||||||||||||||
Same Store Performance Summary By MSA(1)
|
|||||||||||||||||||||||||||||||||||||||||||||||||||||||||||||||||||||||||||||
| (dollars in thousands, except per square foot data) (unaudited) | |||||||||||||||||||||||||||||||||||||||||||||||||||||||||||||||||||||||||||||
| Year Ended December 31, 2019 compared to Year Ended December 31, 2018 | |||||||||||||||||||||||||||||||||||||||||||||||||||||||||||||||||||||||||||||
| Total Revenue | Property Operating Expenses | Net Operating Income | Net Operating Income Margin | ||||||||||||||||||||||||||||||||||||||||||||||||||||||||||||||||||||||||||
MSA(1)
|
Stores | YTD 2019 | YTD 2018 | Growth | YTD 2019 | YTD 2018 | Growth | YTD 2019 | YTD 2018 | Growth | YTD 2019 | YTD 2018 | Growth | ||||||||||||||||||||||||||||||||||||||||||||||||||||||||||||||||
| Riverside-San Bernardino-Ontario, CA | 46 | $ | 38,150 | $ | 36,606 | 4.2 | % | $ | 9,591 | $ | 9,561 | 0.3 | % | $ | 28,559 | $ | 27,045 | 5.6 | % | 74.9 | % | 73.9 | % | 1.0 | % | ||||||||||||||||||||||||||||||||||||||||||||||||||||
| Portland-Vancouver-Hillsboro, OR-WA | 45 | 30,436 | 30,137 | 1.0 | % | 7,764 | 7,716 | 0.6 | % | 22,672 | 22,421 | 1.1 | % | 74.5 | % | 74.4 | % | 0.1 | % | ||||||||||||||||||||||||||||||||||||||||||||||||||||||||||
| Atlanta-Sandy Springs-Roswell, GA | 25 | 14,821 | 13,561 | 9.3 | % | 4,418 | 4,241 | 4.2 | % | 10,403 | 9,320 | 11.6 | % | 70.2 | % | 68.7 | % | 1.5 | % | ||||||||||||||||||||||||||||||||||||||||||||||||||||||||||
| Dallas-Fort Worth-Arlington, TX | 17 | 9,061 | 8,828 | 2.6 | % | 3,518 | 3,427 | 2.7 | % | 5,543 | 5,401 | 2.6 | % | 61.2 | % | 61.2 | % | — | % | ||||||||||||||||||||||||||||||||||||||||||||||||||||||||||
| Oklahoma City, OK | 17 | 8,151 | 7,907 | 3.1 | % | 2,667 | 2,543 | 4.9 | % | 5,484 | 5,364 | 2.2 | % | 67.3 | % | 67.8 | % | (0.5) | % | ||||||||||||||||||||||||||||||||||||||||||||||||||||||||||
| Indianapolis-Carmel-Anderson, IN | 16 | 10,152 | 9,675 | 4.9 | % | 3,054 | 3,113 | (1.9) | % | 7,098 | 6,562 | 8.2 | % | 69.9 | % | 67.8 | % | 2.1 | % | ||||||||||||||||||||||||||||||||||||||||||||||||||||||||||
| Los Angeles-Long Beach-Anaheim, CA | 14 | 19,789 | 19,332 | 2.4 | % | 5,345 | 5,188 | 3.0 | % | 14,444 | 14,144 | 2.1 | % | 73.0 | % | 73.2 | % | (0.2) | % | ||||||||||||||||||||||||||||||||||||||||||||||||||||||||||
| Tulsa, OK | 13 | 6,588 | 6,438 | 2.3 | % | 1,966 | 1,910 | 2.9 | % | 4,622 | 4,528 | 2.1 | % | 70.2 | % | 70.3 | % | (0.1) | % | ||||||||||||||||||||||||||||||||||||||||||||||||||||||||||
| North Port-Sarasota-Bradenton, FL | 12 | 10,766 | 10,334 | 4.2 | % | 3,340 | 3,464 | (3.6) | % | 7,426 | 6,870 | 8.1 | % | 69.0 | % | 66.5 | % | 2.5 | % | ||||||||||||||||||||||||||||||||||||||||||||||||||||||||||
| Phoenix-Mesa-Scottsdale, AZ | 12 | 10,315 | 10,062 | 2.5 | % | 2,938 | 2,773 | 6.0 | % | 7,377 | 7,289 | 1.2 | % | 71.5 | % | 72.4 | % | (0.9) | % | ||||||||||||||||||||||||||||||||||||||||||||||||||||||||||
| Las Vegas-Henderson-Paradise, NV | 11 | 7,939 | 7,265 | 9.3 | % | 2,199 | 2,230 | (1.4) | % | 5,740 | 5,035 | 14.0 | % | 72.3 | % | 69.3 | % | 3.0 | % | ||||||||||||||||||||||||||||||||||||||||||||||||||||||||||
| Other MSAs | 211 | 131,009 | 125,675 | 4.2 | % | 41,894 | 41,096 | 1.9 | % | 89,115 | 84,579 | 5.4 | % | 68.0 | % | 67.3 | % | 0.7 | % | ||||||||||||||||||||||||||||||||||||||||||||||||||||||||||
| Total/Weighted Average | 439 | $ | 297,177 | $ | 285,820 | 4.0 | % | $ | 88,694 | $ | 87,262 | 1.6 | % | $ | 208,483 | $ | 198,558 | 5.0 | % | 70.2 | % | 69.5 | % | 0.7 | % | ||||||||||||||||||||||||||||||||||||||||||||||||||||
(1) MSA (Metropolitan Statistical Area) as defined by the United States Census Bureau. |
||||||||||||||||||||
23
| Supplemental Schedule 7 (continued) | ||||||||||||||||||||||||||||||||||||||||||||||||||||||||||||||
Same Store Performance Summary By MSA(1)
|
||||||||||||||||||||||||||||||||||||||||||||||||||||||||||||||
| (dollars in thousands, except per square foot data) (unaudited) | ||||||||||||||||||||||||||||||||||||||||||||||||||||||||||||||
| Year Ended December 31, 2019 compared to Year Ended December 31, 2018 | ||||||||||||||||||||||||||||||||||||||||||||||||||||||||||||||
| Rentable Square Feet | Occupancy at Period End | Average Occupancy | Average Annualized Rental Revenue per Occupied Square Foot | |||||||||||||||||||||||||||||||||||||||||||||||||||||||||||
MSA(1)
|
Units | YTD 2019 | YTD 2018 | Growth | YTD 2019 | YTD 2018 | Growth | YTD 2019 | YTD 2018 | Growth | ||||||||||||||||||||||||||||||||||||||||||||||||||||
| Riverside-San Bernardino-Ontario, CA | 24,873 | 3,343,166 | 89.6 | % | 89.2 | % | 0.4 | % | 90.5 | % | 91.6 | % | (1.1) | % | $ | 12.00 | $ | 11.37 | 5.5 | % | ||||||||||||||||||||||||||||||||||||||||||
| Portland-Vancouver-Hillsboro, OR-WA | 17,618 | 2,152,373 | 81.2 | % | 82.8 | % | (1.6) | % | 84.2 | % | 85.1 | % | (0.9) | % | 16.49 | 16.15 | 2.1 | % | ||||||||||||||||||||||||||||||||||||||||||||
| Atlanta-Sandy Springs-Roswell, GA | 11,493 | 1,577,880 | 88.8 | % | 87.9 | % | 0.9 | % | 90.0 | % | 86.8 | % | 3.2 | % | 10.10 | 9.61 | 5.1 | % | ||||||||||||||||||||||||||||||||||||||||||||
| Dallas-Fort Worth-Arlington, TX | 6,423 | 858,292 | 87.4 | % | 86.0 | % | 1.4 | % | 87.8 | % | 88.1 | % | (0.3) | % | 11.66 | 11.38 | 2.5 | % | ||||||||||||||||||||||||||||||||||||||||||||
| Oklahoma City, OK | 7,723 | 1,087,927 | 87.8 | % | 84.1 | % | 3.7 | % | 87.3 | % | 83.9 | % | 3.4 | % | 8.34 | 8.42 | (1.0) | % | ||||||||||||||||||||||||||||||||||||||||||||
| Indianapolis-Carmel-Anderson, IN | 8,777 | 1,134,820 | 89.6 | % | 88.8 | % | 0.8 | % | 90.4 | % | 88.1 | % | 2.3 | % | 9.63 | 9.40 | 2.4 | % | ||||||||||||||||||||||||||||||||||||||||||||
| Los Angeles-Long Beach-Anaheim, CA | 9,743 | 1,063,014 | 86.1 | % | 88.2 | % | (2.1) | % | 88.2 | % | 90.3 | % | (2.1) | % | 20.24 | 19.32 | 4.8 | % | ||||||||||||||||||||||||||||||||||||||||||||
| Tulsa, OK | 6,125 | 814,915 | 87.2 | % | 86.4 | % | 0.8 | % | 87.9 | % | 86.3 | % | 1.6 | % | 8.92 | 8.87 | 0.6 | % | ||||||||||||||||||||||||||||||||||||||||||||
| North Port-Sarasota-Bradenton, FL | 7,778 | 756,319 | 84.4 | % | 84.5 | % | (0.1) | % | 84.9 | % | 85.6 | % | (0.7) | % | 16.16 | 15.83 | 2.1 | % | ||||||||||||||||||||||||||||||||||||||||||||
| Phoenix-Mesa-Scottsdale, AZ | 7,407 | 833,199 | 85.5 | % | 84.3 | % | 1.2 | % | 86.4 | % | 86.5 | % | (0.1) | % | 13.81 | 13.47 | 2.5 | % | ||||||||||||||||||||||||||||||||||||||||||||
| Las Vegas-Henderson-Paradise, NV | 5,825 | 736,215 | 89.9 | % | 91.9 | % | (2.0) | % | 90.9 | % | 93.2 | % | (2.3) | % | 11.36 | 10.26 | 10.7 | % | ||||||||||||||||||||||||||||||||||||||||||||
| Other MSAs | 97,571 | 12,651,497 | 87.5 | % | 88.1 | % | (0.6) | % | 89.3 | % | 88.9 | % | 0.4 | % | 11.22 | 10.83 | 3.6 | % | ||||||||||||||||||||||||||||||||||||||||||||
| Total/Weighted Average | 211,356 | 27,009,617 | 87.3 | % | 87.4 | % | (0.1) | % | 88.8 | % | 88.5 | % | 0.3 | % | $ | 11.98 | $ | 11.58 | 3.5 | % | ||||||||||||||||||||||||||||||||||||||||||
(1) MSA (Metropolitan Statistical Area) as defined by the United States Census Bureau. |
||||||||||||||||||||
24
| Supplemental Schedule 8 | |||||||||||||||||||||||||||||||||||||||||
| Same Store Operating Data (439 Stores) - Trailing Five Quarters | |||||||||||||||||||||||||||||||||||||||||
| (dollars in thousands, except per square foot data) (unaudited) | |||||||||||||||||||||||||||||||||||||||||
| 4Q 2019 | 3Q 2019 | 2Q 2019 | 1Q 2019 | 4Q 2018 | YTD 2019 | YTD 2018 | |||||||||||||||||||||||||||||||||||
| Revenue | |||||||||||||||||||||||||||||||||||||||||
| Rental revenue | $ | 72,319 | $ | 73,444 | $ | 71,481 | $ | 69,935 | $ | 70,430 | $ | 287,179 | $ | 276,377 | |||||||||||||||||||||||||||
| Other property-related revenue | 2,473 | 2,571 | 2,580 | 2,374 | 2,345 | 9,998 | 9,443 | ||||||||||||||||||||||||||||||||||
| Total revenue | 74,792 | 76,015 | 74,061 | 72,309 | 72,775 | 297,177 | 285,820 | ||||||||||||||||||||||||||||||||||
| Property operating expenses | |||||||||||||||||||||||||||||||||||||||||
| Store payroll and related costs | 6,842 | 6,845 | 6,848 | 6,911 | 6,742 | 27,446 | 26,952 | ||||||||||||||||||||||||||||||||||
| Property tax expense | 5,714 | 6,169 | 5,929 | 6,206 | 6,006 | 24,018 | 23,668 | ||||||||||||||||||||||||||||||||||
| Other property operating expenses | 9,207 | 9,581 | 9,276 | 9,166 | 8,957 | 37,230 | 36,642 | ||||||||||||||||||||||||||||||||||
| Total property operating expenses | 21,763 | 22,595 | 22,053 | 22,283 | 21,705 | 88,694 | 87,262 | ||||||||||||||||||||||||||||||||||
| Net operating income | $ | 53,029 | $ | 53,420 | $ | 52,008 | $ | 50,026 | $ | 51,070 | $ | 208,483 | $ | 198,558 | |||||||||||||||||||||||||||
| Net operating income margin | 70.9 | % | 70.3 | % | 70.2 | % | 69.2 | % | 70.2 | % | 70.2 | % | 69.5 | % | |||||||||||||||||||||||||||
| Occupancy at period end | 87.3 | % | 89.4 | % | 90.9 | % | 88.6 | % | 87.4 | % | 87.3 | % | 87.4 | % | |||||||||||||||||||||||||||
| Average occupancy | 88.2 | % | 90.2 | % | 89.6 | % | 87.7 | % | 88.2 | % | 88.8 | % | 88.5 | % | |||||||||||||||||||||||||||
| Average annualized rental revenue per occupied square foot | $ | 12.14 | $ | 12.06 | $ | 11.81 | $ | 11.82 | $ | 11.83 | $ | 11.98 | $ | 11.58 | |||||||||||||||||||||||||||
25
| Supplemental Schedule 9 | |||||||||||||||||||||||||||||||||||||||||
| Reconciliation of Same Store Data and Net Operating Income to Net Income | |||||||||||||||||||||||||||||||||||||||||
| (dollars in thousands) (unaudited) | |||||||||||||||||||||||||||||||||||||||||
| 4Q 2019 | 3Q 2019 | 2Q 2019 | 1Q 2019 | 4Q 2018 | YTD 2019 | YTD 2018 | |||||||||||||||||||||||||||||||||||
| Rental revenue | |||||||||||||||||||||||||||||||||||||||||
Same store portfolio |
$ | 72,319 | $ | 73,444 | $ | 71,481 | $ | 69,935 | $ | 70,430 | $ | 287,179 | $ | 276,377 | |||||||||||||||||||||||||||
Non-same store portfolio |
19,764 | 19,302 | 15,694 | 12,920 | 9,071 | 67,680 | 23,462 | ||||||||||||||||||||||||||||||||||
Effect of bad debt expense classification resulting from adoption of leasing standard(1)
|
— | — | — | — | 2,325 | — | 8,564 | ||||||||||||||||||||||||||||||||||
Total rental revenue (as reported) |
92,083 | 92,746 | 87,175 | 82,855 | 81,826 | 354,859 | 308,403 | ||||||||||||||||||||||||||||||||||
| Other property-related revenue | |||||||||||||||||||||||||||||||||||||||||
Same store portfolio |
2,473 | 2,571 | 2,580 | 2,374 | 2,345 | 9,998 | 9,443 | ||||||||||||||||||||||||||||||||||
Non-same store portfolio |
660 | 646 | 548 | 450 | 281 | 2,304 | 740 | ||||||||||||||||||||||||||||||||||
Total other property-related revenue |
3,133 | 3,217 | 3,128 | 2,824 | 2,626 | 12,302 | 10,183 | ||||||||||||||||||||||||||||||||||
| Property operating expenses | |||||||||||||||||||||||||||||||||||||||||
Same store portfolio |
21,763 | 22,595 | 22,053 | 22,283 | 21,705 | 88,694 | 87,262 | ||||||||||||||||||||||||||||||||||
Non-same store portfolio |
5,949 | 6,393 | 5,137 | 4,174 | 2,883 | 21,653 | 8,049 | ||||||||||||||||||||||||||||||||||
Effect of bad debt expense classification resulting from adoption of leasing standard(1)
|
— | — | — | — | 2,325 | — | 8,564 | ||||||||||||||||||||||||||||||||||
Total property operating expenses (as reported) |
27,712 | 28,988 | 27,190 | 26,457 | 26,913 | 110,347 | 103,875 | ||||||||||||||||||||||||||||||||||
| Net operating income | 67,504 | 66,975 | 63,113 | 59,222 | 57,539 | 256,814 | 214,711 | ||||||||||||||||||||||||||||||||||
| Management fees and other revenue | 5,352 | 5,374 | 5,116 | 4,893 | 4,846 | 20,735 | 12,310 | ||||||||||||||||||||||||||||||||||
| General and administrative expenses | (11,606) | (12,039) | (11,170) | (10,766) | (10,606) | (45,581) | (36,220) | ||||||||||||||||||||||||||||||||||
| Depreciation and amortization | (27,343) | (27,598) | (25,829) | (24,349) | (22,921) | (105,119) | (89,147) | ||||||||||||||||||||||||||||||||||
| Interest expense | (14,874) | (14,432) | (13,947) | (13,211) | (11,961) | (56,464) | (42,724) | ||||||||||||||||||||||||||||||||||
| Equity in losses of unconsolidated real estate ventures | (8) | (1,214) | (1,646) | (2,102) | (1,713) | (4,970) | (1,423) | ||||||||||||||||||||||||||||||||||
| Acquisition costs | (534) | (321) | (305) | (157) | (192) | (1,317) | (663) | ||||||||||||||||||||||||||||||||||
| Non-operating income (expense) | 727 | (8) | (169) | (98) | (160) | 452 | (91) | ||||||||||||||||||||||||||||||||||
| Gain on sale of self storage properties | — | — | 2,814 | — | — | 2,814 | 391 | ||||||||||||||||||||||||||||||||||
| Income tax expense | (392) | (223) | (244) | (492) | (349) | (1,351) | (818) | ||||||||||||||||||||||||||||||||||
| Net Income | $ | 18,826 | $ | 16,514 | $ | 17,733 | $ | 12,940 | $ | 14,483 | $ | 66,013 | $ | 56,326 | |||||||||||||||||||||||||||
(1) As a result of the new leasing standard adoption, beginning on January 1, 2019, activity related to uncollectible accounts is presented within revenue. For periods prior to 2019, such amounts were previously included in operating expenses, and as such, for comparability, NSA has presented activity related to uncollectible accounts as a reduction to same store and non-same store revenue and operating expenses. |
||||||||||||||||||||
26
| Supplemental Schedule 10 | |||||||||||||||||||||||
| Selected Financial Information | |||||||||||||||||||||||
| (dollars in thousands, except per square foot data) (unaudited) | |||||||||||||||||||||||
| Three Months Ended December 31, | Year Ended December 31, | ||||||||||||||||||||||
| 2019 | 2018 | 2019 | 2018 | ||||||||||||||||||||
| Average Annualized Rental Revenue Per Occupied Square Foot | |||||||||||||||||||||||
Same store |
$ | 12.14 | $ | 11.83 | $ | 11.98 | $ | 11.58 | |||||||||||||||
Total consolidated portfolio |
12.28 | 12.00 | 12.11 | 11.65 | |||||||||||||||||||
| Average Occupancy | |||||||||||||||||||||||
Same store |
88.2 | % | 88.2 | % | 88.8 | % | 88.5 | % | |||||||||||||||
Total consolidated portfolio |
87.7 | % | 87.9 | % | 88.4 | % | 88.4 | % | |||||||||||||||
| Total Consolidated Portfolio Capital Expenditures | |||||||||||||||||||||||
Recurring capital expenditures |
$ | 1,935 | $ | 1,971 | $ | 8,708 | $ | 6,001 | |||||||||||||||
| Value enhancing capital expenditures | 1,034 | 414 | 4,420 | 3,563 | |||||||||||||||||||
Acquisitions capital expenditures |
1,758 | 1,845 | 8,305 | 9,356 | |||||||||||||||||||
| Total consolidated portfolio capital expenditures | $ | 4,727 | $ | 4,230 | $ | 21,433 | $ | 18,920 | |||||||||||||||
| Property Operating Expenses Detail | |||||||||||||||||||||||
| Store payroll and related costs | $ | 8,721 | $ | 7,645 | $ | 34,083 | $ | 29,518 | |||||||||||||||
| Property tax expense | 7,031 | 6,749 | 29,180 | 25,692 | |||||||||||||||||||
| Other property operating expenses | 11,960 | 10,194 | 47,084 | 40,101 | |||||||||||||||||||
| Bad debt expense | — | 2,325 | — | 8,564 | |||||||||||||||||||
Property operating expenses on the Company's statements of operations |
$ | 27,712 | $ | 26,913 | $ | 110,347 | $ | 103,875 | |||||||||||||||
| General and Administrative Expenses Detail | |||||||||||||||||||||||
| Supervisory and administrative expenses | $ | 5,157 | $ | 4,352 | $ | 19,982 | $ | 16,929 | |||||||||||||||
| Equity-based compensation expense | 1,154 | 1,029 | 4,527 | 3,837 | |||||||||||||||||||
| Other general and administrative expenses | 5,295 | 5,225 | 21,072 | 15,454 | |||||||||||||||||||
General and administrative expenses on the Company's statements of operations |
$ | 11,606 | $ | 10,606 | $ | 45,581 | $ | 36,220 | |||||||||||||||
27
Glossary
This Earnings Release and Supplemental Financial Information includes certain financial and operating measures used by NSA management that are not calculated in accordance with accounting principles generally accepted in the United States, or GAAP. NSA's definitions and calculations of these non-GAAP financial and operating measures and other terms may differ from the definitions and methodologies used by other real estate companies and, accordingly, may not be comparable. These non-GAAP financial and operating measures should not be considered an alternative to GAAP net income or any other GAAP measurement of performance and should not be considered an alternative measure of liquidity.
2016 JOINT VENTURE: NSA's 2016 Joint Venture was formed in 2016 with a major state pension fund advised by Heitman Capital Management LLC. NSA's ownership in the 2016 Joint Venture is 25% and NSA earns customary fees for managing and operating the 2016 Joint Venture properties. In connection with the 2016 Joint Venture’s acquisition of an initial portfolio of self storage properties, NSA separately acquired the property management platform related to the initial portfolio, including a property management company, a captive insurance company, and related intellectual property, including the iStorage brand, under which NSA's management platform operates the 2016 Joint Venture.
2018 JOINT VENTURE: NSA's 2018 Joint Venture was formed in 2018 with an affiliate of Heitman America Real Estate REIT LLC to acquire a portfolio of over 100 self storage properties. NSA's ownership in the 2018 Joint Venture is 25% and NSA earns customary fees for managing and operating the 2018 Joint Venture properties. Substantially all of the 2018 Joint Venture properties are operated by NSA's management platform under NSA's iStorage brand.
AVERAGE ANNUALIZED RENTAL REVENUE PER OCCUPIED SQUARE FOOT: Average annualized rental revenue per occupied square foot is computed by dividing annualized rental revenue (including fees and net of any discounts and uncollectible customer amounts) by average occupied square feet.
AVERAGE OCCUPANCY: Average occupancy is calculated based on the average of the month-end occupancy immediately preceding the period presented and the month-end occupancies included in the respective period presented.
CAPITAL EXPENDITURES DEFINITIONS
ACQUISITIONS CAPITAL EXPENDITURES: Acquisitions capital expenditures represents the portion of capital expenditures capitalized during the current period that were identified and underwritten prior to a property's acquisition.
RECURRING CAPITAL EXPENDITURES: Recurring capital expenditures represents the portion of capital expenditures that are deemed to replace the consumed portion of acquired capital assets and extend their useful lives.
VALUE ENHANCING CAPITAL EXPENDITURES: Value enhancing capital expenditures represents the portion of capital expenditures that are made to enhance the revenue and value of an asset from its original purchase condition.
EBITDA: NSA defines EBITDA as net income (loss), as determined under GAAP, plus interest expense, loss on early extinguishment of debt, income taxes, depreciation and amortization expense and the Company's share of unconsolidated real estate venture depreciation and amortization. NSA defines ADJUSTED EBITDA as EBITDA plus acquisition costs, organizational and offering expenses, equity-based compensation expense, losses on sale of properties and impairment of long-lived assets, minus gains on sale of properties and debt forgiveness, and after adjustments for unconsolidated partnerships and joint ventures. These further adjustments eliminate the impact of items that the Company does not consider indicative of its core operating performance. In evaluating EBITDA and Adjusted EBITDA, you should be aware that in the future the Company may incur expenses that are the same as or similar to some of the adjustments in this presentation. NSA's presentation of EBITDA and Adjusted EBITDA should not be construed as an inference that its future results will be unaffected by unusual or non-recurring items.
NSA presents EBITDA and Adjusted EBITDA because the Company believes they assist investors and analysts in comparing the Company's performance across reporting periods on a consistent basis by excluding items that the Company does not believe are indicative of its core operating performance. EBITDA and Adjusted EBITDA have limitations as an analytical tool. Some of these limitations are:
28
•EBITDA and Adjusted EBITDA do not reflect the Company's cash expenditures, or future requirements, for capital expenditures, contractual commitments or working capital needs;
•EBITDA and Adjusted EBITDA do not reflect the significant interest expense, or the cash requirements necessary to service interest or principal payments, on the Company's debts;
•although depreciation and amortization are non-cash charges, the assets being depreciated and amortized will often have to be replaced in the future, and EBITDA and Adjusted EBITDA do not reflect any cash requirements for such replacements;
•Adjusted EBITDA excludes equity-based compensation expense, which is and will remain a key element of the Company's overall long-term incentive compensation package, although the Company excludes it as an expense when evaluating its ongoing operating performance for a particular period;
•EBITDA and Adjusted EBITDA do not reflect the impact of certain cash charges resulting from matters the Company considers not to be indicative of its ongoing operations; and
•other companies in NSA's industry may calculate EBITDA and Adjusted EBITDA differently than NSA does, limiting their usefulness as comparative measures.
NSA compensates for these limitations by considering the economic effect of the excluded expense items independently as well as in connection with the Company's analysis of net income (loss). EBITDA and Adjusted EBITDA should be considered in addition to, but not as a substitute for, other measures of financial performance reported in accordance with GAAP, such as total revenues and net income (loss).
FUNDS FROM OPERATIONS: Funds from operations, or FFO, is a widely used performance measure for real estate companies and is provided here as a supplemental measure of the Company's operating performance. The December 2018 Nareit Funds From Operations White Paper - 2018 Restatement, which the Company refers to as the White Paper, defines FFO as net income (as determined under GAAP), excluding: real estate depreciation and amortization, gains and losses from the sale of certain real estate assets, gains and losses from change in control, mark-to-market changes in value recognized on equity securities, impairment write-downs of certain real estate assets and impairment of investments in entities when it is directly attributable to decreases in the value of depreciable real estate held by the entity and after items to record unconsolidated partnerships and joint ventures on the same basis. Distributions declared on subordinated performance units and DownREIT subordinated performance units represent NSA's allocation of FFO to noncontrolling interests held by subordinated performance unitholders and DownREIT subordinated performance unitholders. For purposes of calculating FFO attributable to common shareholders, OP unitholders, and LTIP unitholders, NSA excludes distributions declared on subordinated performance units, DownREIT subordinated performance units, preferred shares and preferred units. NSA defines CORE FFO as FFO, as further adjusted to eliminate the impact of certain items that the Company does not consider indicative of its core operating performance. These further adjustments consist of acquisition costs, organizational and offering costs, gains on debt forgiveness, gains (losses) on early extinguishment of debt, and after adjustments for unconsolidated partnerships and joint ventures.
Management uses FFO and Core FFO as key performance indicators in evaluating the operations of NSA's properties. Given the nature of NSA's business as a real estate owner and operator, the Company considers FFO and Core FFO as key supplemental measures of its operating performance that are not specifically defined by GAAP. NSA believes that FFO and Core FFO are useful to management and investors as a starting point in measuring the Company's operational performance because FFO and Core FFO exclude various items included in net income (loss) that do not relate to or are not indicative of the Company's operating performance such as gains (or losses) from sales of self storage properties and depreciation, which can make periodic and peer analyses of operating performance more difficult. NSA's computation of FFO and Core FFO may not be comparable to FFO reported by other REITs or real estate companies.
FFO and Core FFO should be considered in addition to, but not as a substitute for, other measures of financial performance reported in accordance with GAAP, such as total revenues, operating income and net income (loss). FFO and Core FFO do not represent cash generated from operating activities determined in accordance with GAAP and are not a measure of liquidity or an indicator of NSA's ability to make cash distributions. NSA believes that to further understand the Company's performance, FFO and Core FFO should be compared with the Company's reported net income (loss) and considered in addition to cash flows computed in accordance with GAAP, as presented in the Company's consolidated financial statements.
HYPOTHETICAL LIQUIDATION AT BOOK VALUE METHOD: In accordance with GAAP, the Company allocates income (loss) utilizing the hypothetical liquidation at book value ("HLBV") method, in which the Company allocates
29
income or loss based on the change in each unitholders’ claim on the net assets of the Company's operating partnership at period end after adjusting for any distributions or contributions made during such period. The Company uses this method because of the difference between the distribution rights and priorities set forth in the operating partnership's Agreement of Limited Partnership and what is reflected by the underlying percentage ownership interests of the unitholders.
The HLBV method is a balance sheet-focused approach to income (loss) allocation. A calculation is prepared at each balance sheet date to determine the amount that unitholders would receive if the operating partnership were to liquidate all of its assets (at GAAP net book value) and distribute the resulting proceeds to its creditors and unitholders based on the contractually defined liquidation priorities. The difference between the calculated liquidation distribution amounts at the beginning and the end of the reporting period, after adjusting for capital contributions and distributions, is used to derive each unitholder's share of the income (loss) for the period. Due to the stated liquidation priorities and because the HLBV method incorporates non-cash items such as depreciation expense, in any given period, income or loss may be allocated disproportionately to unitholders as compared to their respective ownership percentage in the operating partnership, and net income (loss) attributable to National Storage Affiliates Trust could be more or less net income than actual cash distributions received and more or less income or loss than what may be received in the event of an actual liquidation. Additionally, the HLBV method could result in net income (or net loss) attributable to National Storage Affiliates Trust during a period when the Company reports consolidated net loss (or net income), or net income (or net loss) attributable to National Storage Affiliates Trust in excess of the Company's consolidated net income (or net loss). The computations of basic and diluted earnings (loss) per share may be materially affected by these disproportionate income (loss) allocations, resulting in volatile fluctuations of basic and diluted earnings (loss) per share. Readers and investors are cautioned not to place undue reliance on NSA's income (loss) allocations or earnings (loss) per share without considering the effects described above, including the effect that depreciation and amortization have on income (loss), net book value and the application of the HLBV method.
LONG-TERM INCENTIVE PLAN UNITS: Long-term incentive plan units, or LTIP units, are a special class of partnership interest in NSA's operating partnership that allow the holder to participate in the ordinary and liquidating distributions received by holders of the operating partnership units (subject to the achievement of specified levels of profitability by our operating partnership or the achievement of certain events). Upon vesting, and after achieving parity with operating partnership units, vested LTIP units may be converted into an equal number of operating partnership units, and thereafter have all the rights of operating partnership units, including redemption rights.
NET DEBT TO ANNUALIZED CURRENT QUARTER ADJUSTED EBITDA: NSA calculates net debt to Adjusted EBITDA as total debt (inclusive of $6.6 million of fair value of debt adjustments and $11.8 million of debt issuance costs) less cash and cash equivalents, divided by annualized current quarter Adjusted EBITDA.
NET OPERATING INCOME: NSA defines net operating income, or NOI, as net income (loss), as determined under GAAP, plus general and administrative expenses, depreciation and amortization, interest expense, loss on early extinguishment of debt, equity in earnings (losses) of unconsolidated real estate ventures, acquisition costs, organizational and offering expenses, income tax expense, impairment of long-lived assets, losses on the sale of properties and non-operating expense and by subtracting management fees and other revenue, gains on sale of properties, debt forgiveness, and non-operating income. NOI is not a measure of performance calculated in accordance with GAAP.
NSA believes NOI is useful to investors in evaluating the Company's operating performance because:
•NOI is one of the primary measures used by NSA's management and the Company's PROs to evaluate the economic productivity of the Company's properties, including the Company's ability to lease its properties, increase pricing and occupancy and control the Company's property operating expenses;
•NOI is widely used in the real estate industry and the self storage industry to measure the performance and value of real estate assets without regard to various items included in net income that do not relate to or are not indicative of operating performance, such as depreciation and amortization, which can vary depending upon accounting methods, the book value of assets, and the impact of NSA's capital structure; and
•NSA believes NOI helps the Company's investors to meaningfully compare the results of its operating performance from period to period by removing the impact of the Company's capital structure (primarily interest expense on the Company's outstanding indebtedness) and depreciation of the cost basis of NSA's assets from its operating results.
30
There are material limitations to using a non-GAAP measure such as NOI, including the difficulty associated with comparing results among more than one company and the inability to analyze certain significant items, including depreciation and interest expense, that directly affect the Company's net income (loss). NSA compensates for these limitations by considering the economic effect of the excluded expense items independently as well as in connection with the Company's analysis of net income (loss). NOI should be considered in addition to, but not as a substitute for, other measures of financial performance reported in accordance with GAAP, such as total revenues and net loss.
NET OPERATING INCOME MARGIN: The ratio of NOI divided by total rental and other property-related revenue.
NON-SAME STORE PORTFOLIO: Non-same store portfolio comprises those properties that do not meet the Same Store portfolio property definition.
OCCUPANCY AT PERIOD END: Represents total occupied rentable square feet divided by total rentable square feet at period end.
OPERATING PARTNERSHIP UNITS: Operating partnership units, or OP Units, are Class A common units of limited partner interest in the Company's operating partnership which are economically equivalent to NSA's common shares. NSA also owns certain of the Company's self storage properties through other consolidated limited partnership subsidiaries of the Company's operating partnership, which the Company refers to as "DownREIT partnerships." The DownREIT partnerships issue certain units of limited partner or limited liability company interest that are intended to be economically equivalent to the Company's OP units, which the Company defines as DOWNREIT OPERATING PARTNERSHIP UNIT EQUIVALENTS, or DownREIT OP units.
PROs: Participating regional operators, or "PROs", are NSA's experienced regional self storage operators with local operational focus and expertise. As of December 31, 2019, the Company had ten PROs, SecurCare Self Storage, Northwest Self Storage, Optivest Properties, Guardian Storage Centers, Move It Self Storage, Storage Solutions, Hide-Away, Personal Mini, Southern Self Storage and Moove In Self Storage.
RENTABLE SQUARE FEET: Rentable square feet includes all enclosed self storage units but excludes commercial, residential, and covered parking space.
RESTRICTED COMMON SHARES: Restricted common shares are common shares that are subject to restrictions on transferability subject to vesting and such other restrictions. Generally, a participant granted restricted common shares has all of the rights of a shareholder, including, without limitation, the right to vote and the right to receive dividends on the restricted common shares. Holders of restricted common shares are prohibited from selling such shares until they vest.
SAME STORE PORTFOLIO: NSA's same store portfolio is defined as those properties owned and operated since the first day of the earliest year presented, excluding any properties sold, expected to be sold or subject to significant changes such as expansions or casualty events which cause the portfolio's year-over-year operating results to no longer be comparable.
SUBORDINATED PERFORMANCE UNITS: Subordinated performance units, or SP Units, are Class B common units of limited partner interest in the Company's operating partnership. SP units, which are linked to the performance of specific contributed portfolios, are intended to incentivize the Company's PROs to drive operating performance and support the sustainability of the operating cash flow generated by the contributed self storage properties that the PROs continue to manage on NSA's behalf. Because subordinated performance unit holders receive distributions only after portfolio-specific minimum performance thresholds are satisfied, the Company believes SP units play a key role in aligning the interests of the Company's PROs with NSA and the Company's shareholders. The DownREIT partnerships also issue units of limited partner interest that are intended to be economically equivalent to the Company's SP units, which the Company defines as DOWNREIT SUBORDINATED PERFORMANCE UNIT EQUIVALENTS, or DownREIT SP units.
31
| Equity Research Coverage | ||||||||||||||
| Baird Equity Research | BMO Capital Markets | Capital One Securities, Inc. | ||||||||||||
| RJ Milligan | R. Jeremy Metz | Neil Malkin | ||||||||||||
| 813.273.8252 | 212.885.4053 | 571.633.8191 | ||||||||||||
| Citi Investment Research | Jefferies LLC | KeyBanc Capital Markets | ||||||||||||
| Michael Bilerman / Smedes Rose | Jonathan Petersen / Reuben Treatman | Todd Thomas / Jordan Sadler | ||||||||||||
| 212.816.1383 / 212.816.6243 | 212.284.1705 / 212.323.3307 | 917.368.2286 / 917.368.2280 | ||||||||||||
| Morgan Stanley | Stifel | SunTrust Robinson Humphrey | ||||||||||||
| Ronald Kamdem | Stephen Manaker / Kevin Stein | Ki Bin Kim / Ian Gaule | ||||||||||||
| 212.296.8319 | 212.271.3716 / 212.271.3718 | 212.303.4124 / 212.590.0948 | ||||||||||||
| Wells Fargo Securities, LLC | ||||||||||||||
| Todd Stender / Philip Defelice | ||||||||||||||
| 562.637.1371 / 443.263.6442 | ||||||||||||||
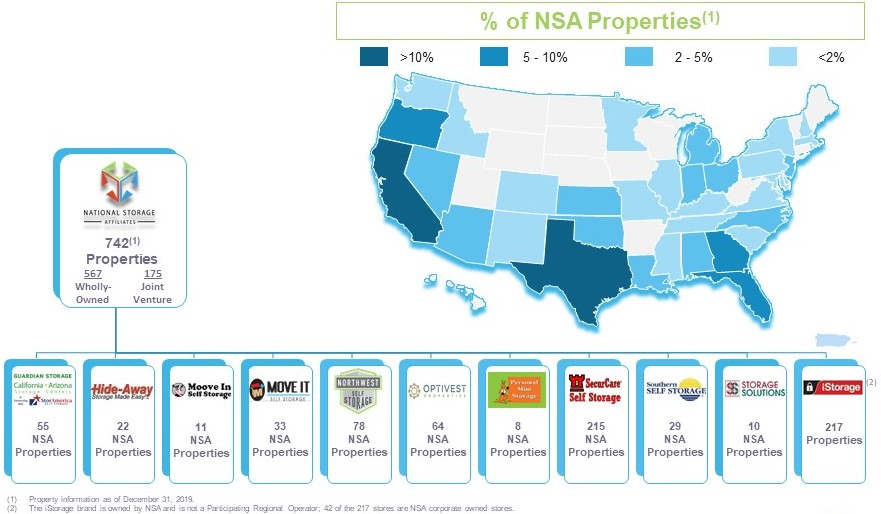
32