EX-99.1
Published on May 4, 2022


Table of Contents
| Page | |||||
| Earnings Release | |||||
| Consolidated Statements of Operations | |||||
| Consolidated Balance Sheets | |||||
| Schedule 1 - Funds From Operations and Core Funds From Operations | |||||
| Schedule 2 - Other Non-GAAP Financial Measurements | |||||
| Schedule 3 - Portfolio Summary | |||||
| Schedule 4 - Debt and Equity Capitalization | |||||
| Schedule 5 - Summarized Information for Unconsolidated Real Estate Ventures | |||||
| Schedule 6 - Same Store Performance Summary By State | |||||
| Schedule 7 - Same Store Performance Summary By MSA | |||||
| Schedule 8 - Same Store Operating Data - Trailing Five Quarters | |||||
| Schedule 9 - Reconciliation of Same Store Data and Net Operating Income to Net Income | |||||
| Schedule 10 - Selected Financial Information | |||||
| Glossary | |||||
May 4, 2022
National Storage Affiliates Trust Reports First Quarter 2022 Results
GREENWOOD VILLAGE, Colo. - (BUSINESS WIRE) - National Storage Affiliates Trust ("NSA" or the "Company") (NYSE: NSA) today reported the Company’s first quarter 2022 results.
First Quarter 2022 Highlights
•Reported net income of $44.8 million for the first quarter of 2022, an increase of 62.1% compared to the first quarter of 2021. Reported diluted earnings per share of $0.24 for the first quarter of 2022 compared to $0.19 for the first quarter of 2021.
•Reported core funds from operations ("Core FFO") of $87.4 million, or $0.68 per share for the first quarter of 2022, an increase of 38.8% per share compared to the first quarter of 2021.
•Reported an increase in same store net operating income ("NOI") of 22.2% for the first quarter of 2022 compared to the same period in 2021, driven by a 16.6% increase in same store total revenues partially offset by an increase of 3.1% in same store property operating expenses.
•Reported same store period-end occupancy of 94.8% as of March 31, 2022, an increase of 140 basis points compared to March 31, 2021.
•Acquired 12 wholly-owned self storage properties for approximately $92.9 million during the first quarter of 2022. Consideration for these acquisitions included the issuance of $16.6 million of OP equity.
•Issued the previously announced $125.0 million of 2.96% senior unsecured notes due November 30, 2033 in a private placement.
•As previously announced, one of the Company's largest participating regional operators ("PROs"), Kevin Howard Real Estate, Inc., d/b/a Northwest Self Storage and its controlled affiliates ("Northwest"), retired effective January 1, 2022. As a result of the retirement, on January 1, 2022, management of the Company's properties in the Northwest managed portfolio was transferred to NSA and the Northwest brand name and related intellectual property were internalized by the Company. In addition, NSA no longer pays supervisory and administrative fees or reimbursements to Northwest and all subordinated performance units related to Northwest's managed portfolio were converted into OP units.
Highlights Subsequent to Quarter-End
•Kroll Bond Rating Agency upgraded the issuer credit rating of NSA's operating partnership to BBB+ with a Stable Outlook from BBB with a Positive Outlook.
•In April 2022, one of the Company's unconsolidated real estate ventures acquired seven self storage properties for approximately $208 million. The venture financed the acquisition with capital contributions from the venture members, of which the Company contributed approximately $52 million.
Tamara Fischer, President and Chief Executive Officer, commented, “First quarter results confirmed that the favorable performance trends experienced in 2021 are continuing into 2022. Rental demand remains robust, supply remains muted, and we are benefiting from continued strength in rate growth to both new and in-place tenants. The combination of these factors drove the fourth consecutive quarter of NOI growth north of 20%, resulting in 39% core FFO per share growth. Based on this strong performance and favorable April trends, we are pleased to be able to raise our same store NOI growth and core FFO per share guidance for 2022.”
1
Financial Results
($ in thousands, except per share and unit data) |
Three Months Ended March 31, | ||||||||||||||||
| 2022 | 2021 | Growth | |||||||||||||||
| Net income | $ | 44,786 | $ | 27,635 | 62.1 | % | |||||||||||
Funds From Operations ("FFO")(1)
|
$ | 86,856 | $ | 50,907 | 70.6 | % | |||||||||||
Add back acquisition costs |
553 | 292 | 89.4 | % | |||||||||||||
Core FFO(1)
|
$ | 87,409 | $ | 51,199 | 70.7 | % | |||||||||||
| Earnings (loss) per share - basic | $ | 0.24 | $ | 0.24 | — | ||||||||||||
Earnings (loss) per share - diluted |
$ | 0.24 | $ | 0.19 | 26.3 | % | |||||||||||
FFO per share and unit(1)
|
$ | 0.67 | $ | 0.49 | 36.7 | % | |||||||||||
Core FFO per share and unit(1)
|
$ | 0.68 | $ | 0.49 | 38.8 | % | |||||||||||
(1) Non-GAAP financial measures, including FFO, Core FFO and NOI, are defined in the Glossary in the supplemental financial information and, where appropriate, reconciliations of these measures and other non-GAAP financial measures to their most directly comparable GAAP measures are included in the Schedules to this press release and in the supplemental financial information.
Net income increased $17.2 million for the first quarter of 2022 as compared to the same period in 2021. This increase resulted primarily from additional NOI generated from the 206 self storage properties acquired between April 1, 2021 and December 31, 2021, 12 self storage properties acquired during the three months ended March 31, 2022, same store NOI growth of 22.2% in the first quarter of 2022 compared to the same period 2021 and increases in equity in earnings from the Company's unconsolidated real estate ventures, partially offset by increases in depreciation and amortization, interest expense and general and administrative expenses.
The increase in FFO and Core FFO for the first quarter of 2022 was primarily the result of incremental NOI from properties acquired between April 1, 2021 and March 31, 2022 and same store NOI growth, partially offset by an increase in subordinated performance unit distributions.
Same Store Operating Results (631 Stores)
($ in thousands, except per square foot data) |
Three Months Ended March 31, | ||||||||||||||||
| 2022 | 2021 | Growth | |||||||||||||||
Total revenues |
$ | 132,619 | $ | 113,727 | 16.6 | % | |||||||||||
Property operating expenses |
34,317 | 33,284 | 3.1 | % | |||||||||||||
Net Operating Income (NOI) |
$ | 98,302 | $ | 80,443 | 22.2 | % | |||||||||||
| NOI Margin | 74.1 | % | 70.7 | % | 3.4 | % | |||||||||||
Average Occupancy |
94.7 | % | 92.2 | % | 2.5 | % | |||||||||||
Average Annualized Rental Revenue Per Occupied Square Foot |
$ | 14.10 | $ | 12.43 | 13.4 | % | |||||||||||
Year-over-year same store total revenues increased 16.6% for the first quarter of 2022 as compared to the same period in 2021. The increase was driven primarily by a 250 basis point increase in average occupancy and a 13.4% increase in average annualized rental revenue per occupied square foot. Markets which generated above portfolio average same store total revenue growth for the first quarter of 2022 include: Riverside-San Bernardino, Atlanta and Sarasota. Markets which generated below portfolio average same store total revenue growth for the first quarter of 2022 include: Kansas City, Tulsa, and Los Angeles.
Year-over-year same store property operating expenses increased 3.1% for the first quarter of 2022. The increase primarily resulted from increases in property tax expense and utilities.
2
Investment Activity
During the first quarter, NSA invested $92.9 million in the acquisition of 12 self storage properties consisting of approximately 0.7 million rentable square feet configured in approximately 5,000 storage units. Total consideration for these acquisitions included approximately $76.0 million of net cash, $8.9 million of 6.000% Series A-1 cumulative redeemable preferred units, $5.6 million of OP units, $2.1 million of subordinated performance units and the assumption of approximately $0.3 million of other liabilities.
Balance Sheet
On January 28, 2022, the operating partnership issued $125.0 million of 2.96% senior unsecured notes due November 30, 2033 in a private placement to certain institutional investors. The Company used the proceeds to repay outstanding amounts on its revolving line of credit and for general corporate purposes.
On April 11, 2022, Kroll Bond Rating Agency upgraded the issuer credit rating of the Company's operating partnership to BBB+ with a Stable Outlook from BBB with a Positive Outlook.
Common Share Dividends
On February 24, 2022, NSA's Board of Trustees declared a quarterly cash dividend of $0.50 per common share, representing a 43% increase from the first quarter 2021. The first quarter 2022 dividend was paid on March 31, 2022 to shareholders of record as of March 15, 2022.
3
2022 Guidance
The following table outlines NSA's updated and prior FFO guidance estimates and related assumptions for the year ended December 31, 2022:
| Current Ranges for Full Year 2022 |
Prior Ranges for Full Year 2022 |
Actual Results for Full Year 2021 | |||||||||||||||||||||||||||
| Low | High | Low | High | ||||||||||||||||||||||||||
Core FFO per share(1)
|
$2.80 | $2.85 | $2.68 | $2.74 | $2.26 | ||||||||||||||||||||||||
Same store operations(2)
|
|||||||||||||||||||||||||||||
Total revenue growth |
11.0% | 13.0% | 8.0% | 9.5% | 15.1% | ||||||||||||||||||||||||
Property operating expenses growth |
5.0% | 6.25% | 5.25% | 6.5% | 4.0% | ||||||||||||||||||||||||
NOI growth |
14.0% | 16.0% | 9.0% | 11.0% | 19.8% | ||||||||||||||||||||||||
General and administrative expenses |
|||||||||||||||||||||||||||||
General and administrative expenses (excluding equity-based compensation), in millions |
$52.0 | $54.0 | $51.0 | $53.0 | $45.5 | ||||||||||||||||||||||||
| Equity-based compensation, in millions | $6.5 | $7.0 | $6.5 | $7.0 | $5.5 | ||||||||||||||||||||||||
Management fees and other revenue, in millions |
$27.0 | $29.0 | $26.0 | $28.0 | $24.4 | ||||||||||||||||||||||||
Core FFO from unconsolidated real estate ventures, in millions |
$24.0 | $25.0 | $22.0 | $23.0 | $20.7 | ||||||||||||||||||||||||
Subordinated performance unit distributions, in millions |
$58.0 | $61.0 | $52.0 | $55.0 | $49.8 | ||||||||||||||||||||||||
| Acquisitions of self storage properties, in millions | $400.0 | $600.0 | $400.0 | $600.0 | $2,175.0 | ||||||||||||||||||||||||
| Current Ranges for Full Year 2022 |
Prior Ranges for Full Year 2022 |
||||||||||||||||||||||
| Low | High | Low | High | ||||||||||||||||||||
| Earnings (loss) per share - diluted | $1.28 | $1.38 | $1.12 | $1.22 | |||||||||||||||||||
Impact of the difference in weighted average number of shares and GAAP accounting for noncontrolling interests, two-class method and treasury stock method |
0.16 | 0.02 | 0.19 | 0.07 | |||||||||||||||||||
Add real estate depreciation and amortization, including NSA's share of unconsolidated venture real estate depreciation and amortization |
1.80 | 1.90 | 1.76 | 1.86 | |||||||||||||||||||
FFO attributable to subordinated unitholders |
(0.45) | (0.47) | (0.40) | (0.43) | |||||||||||||||||||
Add acquisition costs and NSA's share of unconsolidated real estate venture acquisition costs |
0.01 | 0.02 | 0.01 | 0.02 | |||||||||||||||||||
Core FFO per share and unit |
$2.80 | $2.85 | $2.68 | $2.74 | |||||||||||||||||||
(1) The table above provides a reconciliation of the range of estimated earnings (loss) per share - diluted to estimated Core FFO per share and unit. | |||||||||||||||||||||||
| (2) 2022 guidance reflects NSA's 2022 same store pool comprising 631 stores. 2021 actual results reflect NSA's 2021 same store pool comprising 560 stores. | |||||||||||||||||||||||
The full text of this earnings release and supplemental financial information, including certain financial information referenced in this release, are available on NSA's website at http://ir.nationalstorageaffiliates.com/quarterly-reporting and as exhibit 99.1 to the Company's Form 8-K furnished to the SEC on May 4, 2022.
4
Non-GAAP Financial Measures & Glossary
This press release contains certain non-GAAP financial measures. These non-GAAP measures are presented because NSA's management believes these measures help investors understand NSA's business, performance and ability to earn and distribute cash to its shareholders by providing perspectives not immediately apparent from net income (loss). These measures are also frequently used by securities analysts, investors and other interested parties. The presentations of FFO, Core FFO and NOI in this press release are not intended to be considered in isolation or as a substitute for, or superior to, the financial information prepared and presented in accordance with GAAP. In addition, NSA's method of calculating these measures may be different from methods used by other companies, and, accordingly, may not be comparable to similar measures as calculated by other companies that do not use the same methodology as NSA. These measures, and other words and phrases used herein, are defined in the Glossary in the supplemental financial information and, where appropriate, reconciliations of these measures and other non-GAAP financial measures to their most directly comparable GAAP measures are included in the Schedules to this press release and in the supplemental financial information.
Quarterly Teleconference and Webcast
The Company will host a conference call at 11:00 am Eastern Time on Thursday, May 5, 2022 to discuss its first quarter 2022 financial results. At the conclusion of the call, management will accept questions from certified financial analysts. All other participants are encouraged to listen to a webcast of the call by accessing the link found on the Company's website at www.nationalstorageaffiliates.com.
Conference Call and Webcast:
Date/Time: Thursday, May 5, 2022, 11:00am ET
Webcast available at: www.nationalstorageaffiliates.com
Domestic (Toll Free US & Canada): 877.407.9711
International: 412.902.1014
Replay:
Domestic (Toll Free US & Canada): 877.660.6853
International: 201.612.7415
Conference ID: 13692161
A replay of the call will be available for one week through Thursday, May 12, 2022. A replay of the webcast will be available for 30 days on NSA's website at www.nationalstorageaffiliates.com.
Upcoming Industry Conference
NSA management is scheduled to participate in BMO's 2022 Real Estate Summit in New York, New York on May 12, 2022 and in Nareit's REITweek 2022 Investor Conference, June 7-9, 2022 in New York, New York.
About National Storage Affiliates Trust
National Storage Affiliates Trust is a real estate investment trust headquartered in Greenwood Village, Colorado, focused on the ownership, operation and acquisition of self storage properties predominantly located within the top 100 metropolitan statistical areas throughout the United States. As of March 31, 2022, the Company held ownership interests in and operated 1,061 self storage properties located in 42 states and Puerto Rico with approximately 68.4 million rentable square feet. NSA is one of the largest owners and operators of self storage properties among public and private companies in the United States. For more information, please visit the Company’s website at www.nationalstorageaffiliates.com. NSA is included in the MSCI US REIT Index (RMS/RMZ), the Russell 2000 Index of Companies and the S&P MidCap 400 Index.
5
NOTE REGARDING FORWARD LOOKING STATEMENTS
Certain statements contained in this press release constitute forward-looking statements as such term is defined in Section 27A of the Securities Act of 1933, as amended, and Section 21E of the Securities Exchange Act of 1934, as amended, and such statements are intended to be covered by the safe harbor provided by the same. Forward-looking statements are subject to substantial risks and uncertainties, many of which are difficult to predict and are generally beyond the Company's control. These forward-looking statements include information about possible or assumed future results of the Company's business, financial condition, liquidity, results of operations, plans and objectives. Changes in any circumstances may cause the Company's actual results to differ significantly from those expressed in any forward-looking statement. When used in this release, the words "believe," "expect," "anticipate," "estimate," "plan," "continue," "intend," "should," "may" or similar expressions are intended to identify forward-looking statements. Statements regarding the following subjects, among others, may be forward-looking: market trends in the Company's industry, interest rates, the debt and lending markets or the general economy; the Company's business and investment strategy; the acquisition of properties, including those under contract and the Company's ability to execute on its acquisition pipeline; the timing of acquisitions under contract; the internalization of retiring participating regional operators ("PROs") into the Company; negative impacts from the COVID-19 pandemic on the economy, the self storage industry, the broader financial markets, the Company's financial condition, results of operations and cash flows and the ability of the Company's tenants to pay rent; and the Company's guidance estimates for the year ended December 31, 2022. For a further list and description of such risks and uncertainties, see the Company's most recent Annual Report on Form 10-K and subsequent Quarterly Reports on Form 10-Q and Current Reports on Form 8-K filed with the Securities and Exchange Commission, and the other documents filed by the Company with the Securities and Exchange Commission. The forward-looking statements, and other risks, uncertainties and factors are based on the Company's beliefs, assumptions and expectations of its future performance, taking into account all information currently available to the Company. Forward-looking statements are not predictions of future events. The Company disclaims any intention or obligation to update or revise any forward-looking statements, whether as a result of new information, future events or otherwise, except as required by law.
Contact:
National Storage Affiliates Trust
Investor/Media Relations
George Hoglund, CFA
Vice President - Investor Relations
720.630.2160
6
National Storage Affiliates Trust
Consolidated Statements of Operations
(in thousands, except per share amounts)
(unaudited)
| Three Months Ended March 31, | |||||||||||
| 2022 | 2021 | ||||||||||
| REVENUE | |||||||||||
| Rental revenue | $ | 174,469 | $ | 113,127 | |||||||
| Other property-related revenue | 6,166 | 4,137 | |||||||||
| Management fees and other revenue | 6,549 | 5,728 | |||||||||
| Total revenue | 187,184 | 122,992 | |||||||||
| OPERATING EXPENSES | |||||||||||
| Property operating expenses | 49,358 | 34,604 | |||||||||
| General and administrative expenses | 13,966 | 11,238 | |||||||||
| Depreciation and amortization | 58,072 | 32,424 | |||||||||
| Other | 470 | 397 | |||||||||
| Total operating expenses | 121,866 | 78,663 | |||||||||
| OTHER (EXPENSE) INCOME | |||||||||||
| Interest expense | (22,647) | (16,792) | |||||||||
Equity in earnings of unconsolidated real estate ventures |
1,494 | 759 | |||||||||
| Acquisition costs | (553) | (292) | |||||||||
| Non-operating expense | (112) | (173) | |||||||||
| Gain on sale of self storage properties | 2,134 | — | |||||||||
| Other expense | (19,684) | (16,498) | |||||||||
| Income before income taxes | 45,634 | 27,831 | |||||||||
| Income tax expense | (848) | (196) | |||||||||
| Net income | 44,786 | 27,635 | |||||||||
Net income attributable to noncontrolling interests |
(19,558) | (6,797) | |||||||||
| Net income attributable to National Storage Affiliates Trust | 25,228 | 20,838 | |||||||||
Distributions to preferred shareholders |
(3,279) | (3,275) | |||||||||
Net income attributable to common shareholders |
$ | 21,949 | $ | 17,563 | |||||||
| Earnings (loss) per share - basic | $ | 0.24 | $ | 0.24 | |||||||
| Earnings (loss) per share - diluted | $ | 0.24 | $ | 0.19 | |||||||
Weighted average shares outstanding - basic |
91,323 | 71,794 | |||||||||
Weighted average shares outstanding - diluted |
91,323 | 123,187 | |||||||||
7
National Storage Affiliates Trust
Consolidated Balance Sheets
(dollars in thousands, except per share amounts)
(unaudited)
| March 31, | December 31, | ||||||||||
| 2022 | 2021 | ||||||||||
| ASSETS | |||||||||||
| Real estate | |||||||||||
| Self storage properties | $ | 5,892,406 | $ | 5,798,188 | |||||||
| Less accumulated depreciation | (624,368) | (578,717) | |||||||||
| Self storage properties, net | 5,268,038 | 5,219,471 | |||||||||
| Cash and cash equivalents | 26,616 | 25,013 | |||||||||
| Restricted cash | 2,531 | 2,862 | |||||||||
| Debt issuance costs, net | 2,121 | 2,433 | |||||||||
| Investment in unconsolidated real estate ventures | 184,547 | 188,187 | |||||||||
| Other assets, net | 115,607 | 102,417 | |||||||||
| Operating lease right-of-use assets | 21,951 | 22,211 | |||||||||
| Total assets | $ | 5,621,411 | $ | 5,562,594 | |||||||
| LIABILITIES AND EQUITY | |||||||||||
| Liabilities | |||||||||||
| Debt financing | $ | 2,999,751 | $ | 2,940,931 | |||||||
| Accounts payable and accrued liabilities | 60,678 | 59,262 | |||||||||
| Interest rate swap liabilities | 3,821 | 33,757 | |||||||||
| Operating lease liabilities | 23,751 | 23,981 | |||||||||
| Deferred revenue | 23,366 | 22,208 | |||||||||
| Total liabilities | 3,111,367 | 3,080,139 | |||||||||
| Equity | |||||||||||
Preferred shares of beneficial interest, par value $0.01 per share. 50,000,000 authorized, 8,744,935 and 8,736,719 issued and outstanding at March 31, 2022 and December 31, 2021, respectively, at liquidation preference |
218,623 | 218,418 | |||||||||
Common shares of beneficial interest, par value $0.01 per share. 250,000,000 shares authorized, 91,461,720 and 91,198,929 shares issued and outstanding at March 31, 2022 and December 31, 2021, respectively |
915 | 912 | |||||||||
| Additional paid-in capital | 1,830,732 | 1,866,773 | |||||||||
| Distributions in excess of earnings | (315,024) | (291,263) | |||||||||
| Accumulated other comprehensive income (loss) | 11,734 | (19,611) | |||||||||
| Total shareholders' equity | 1,746,980 | 1,775,229 | |||||||||
| Noncontrolling interests | 763,064 | 707,226 | |||||||||
| Total equity | 2,510,044 | 2,482,455 | |||||||||
| Total liabilities and equity | $ | 5,621,411 | $ | 5,562,594 | |||||||
8
| Supplemental Schedule 1 | |||||||||||
| Funds From Operations and Core Funds From Operations | |||||||||||
| (in thousands, except per share and unit amounts) (unaudited) | |||||||||||
| Reconciliation of Net Income to FFO and Core FFO | |||||||||||
| Three Months Ended March 31, | |||||||||||
| 2022 | 2021 | ||||||||||
| Net income | $ | 44,786 | $ | 27,635 | |||||||
| Add (subtract): | |||||||||||
| Real estate depreciation and amortization | 57,759 | 32,070 | |||||||||
Company's share of unconsolidated real estate venture real estate depreciation and amortization |
3,846 | 3,881 | |||||||||
Gain on sale of self storage properties |
(2,134) | — | |||||||||
Distributions to preferred shareholders and unitholders |
(3,552) | (3,517) | |||||||||
FFO attributable to subordinated performance unitholders(1)
|
(13,849) | (9,162) | |||||||||
FFO attributable to common shareholders, OP unitholders, and LTIP unitholders |
86,856 | 50,907 | |||||||||
| Add: | |||||||||||
| Acquisition costs | 553 | 292 | |||||||||
Core FFO attributable to common shareholders, OP unitholders, and LTIP unitholders |
$ | 87,409 | $ | 51,199 | |||||||
Weighted average shares and units outstanding - FFO and Core FFO:(2)
|
|||||||||||
| Weighted average shares outstanding - basic | 91,323 | 71,794 | |||||||||
| Weighted average restricted common shares outstanding | 28 | 25 | |||||||||
Weighted average effect of forward offering agreement(3)
|
— | 399 | |||||||||
Weighted average OP units outstanding |
35,351 | 29,751 | |||||||||
Weighted average DownREIT OP unit equivalents outstanding |
1,925 | 1,925 | |||||||||
Weighted average LTIP units outstanding |
603 | 585 | |||||||||
Total weighted average shares and units outstanding - FFO and Core FFO |
129,230 | 104,479 | |||||||||
| FFO per share and unit | $ | 0.67 | $ | 0.49 | |||||||
| Core FFO per share and unit | $ | 0.68 | $ | 0.49 | |||||||
| (1) Amounts represent distributions declared for subordinated performance unitholders and DownREIT subordinated performance unitholders for the periods presented. | |||||||||||
(2) NSA combines OP units and DownREIT OP units with common shares because, after the applicable lock-out periods, OP units in the Company's operating partnership are redeemable for cash or, at NSA's option, exchangeable for common shares on a one-for-one basis and DownREIT OP units are also redeemable for cash or, at NSA's option, exchangeable for OP units in the Company's operating partnership on a one-for-one basis, subject to certain adjustments in each case. Subordinated performance units, DownREIT subordinated performance units and LTIP units may also, under certain circumstances, be convertible into or exchangeable for common shares (or other units that are convertible into or exchangeable for common shares). See footnote(4) for additional discussion of subordinated performance units, DownREIT subordinated performance units, and LTIP units in the calculation of FFO and Core FFO per share and unit.
| |||||||||||
| (3) Represents the dilutive effect of the forward offering from the application of the treasury stock method. | |||||||||||
9
| Supplemental Schedule 1 (continued) | |||||||||||
| Funds From Operations and Core Funds From Operations | |||||||||||
| (in thousands, except per share and unit amounts) (unaudited) | |||||||||||
| Reconciliation of Earnings (Loss) Per Share - Diluted to FFO and Core FFO Per Share and Unit | |||||||||||
| Three Months Ended March 31, | |||||||||||
| 2022 | 2021 | ||||||||||
| Earnings (loss) per share - diluted | $ | 0.24 | $ | 0.19 | |||||||
Impact of the difference in weighted average number of shares(4)
|
(0.07) | 0.04 | |||||||||
Impact of GAAP accounting for noncontrolling interests, two-class method and treasury stock method(5)
|
0.15 | — | |||||||||
| Add real estate depreciation and amortization | 0.45 | 0.31 | |||||||||
Add Company's share of unconsolidated real estate venture real estate depreciation and amortization |
0.03 | 0.04 | |||||||||
| Subtract gain on sale of self storage properties | (0.02) | — | |||||||||
FFO attributable to subordinated performance unitholders |
(0.11) | (0.09) | |||||||||
FFO per share and unit |
0.67 | 0.49 | |||||||||
Add acquisition costs |
0.01 | — | |||||||||
Core FFO per share and unit |
$ | 0.68 | $ | 0.49 | |||||||
(4) Adjustment accounts for the difference between the weighted average number of shares used to calculate diluted earnings per share and the weighted average number of shares used to calculate FFO and Core FFO per share and unit. Diluted earnings per share is calculated using the two-class method for the company's restricted common shares and the treasury stock method for certain unvested LTIP units, and assumes the conversion of vested LTIP units into OP units on a one-for-one basis and the hypothetical conversion of subordinated performance units, and DownREIT subordinated performance units into OP units, even though such units may only be convertible into OP units (i) after a lock-out period and (ii) upon certain events or conditions. For additional information about the conversion of subordinated performance units and DownREIT subordinated performance units into OP units, see Note 10 to the Company's most recent Annual Report on Form 10-K, filed with the Securities and Exchange Commission. The computation of weighted average shares and units for FFO and Core FFO per share and unit includes all restricted common shares and LTIP units that participate in distributions and excludes all subordinated performance units and DownREIT subordinated performance units because their effect has been accounted for through the allocation of FFO to the related unitholders based on distributions declared. | |||||||||||
(5) Represents the effect of adjusting the numerator to consolidated net income (loss) prior to GAAP allocations for noncontrolling interests, after deducting preferred share and unit distributions, and before the application of the two-class method and treasury stock method, as described in footnote(4).
| |||||||||||
10
| Supplemental Schedule 2 | |||||||||||
| Other Non-GAAP Financial Measurements | |||||||||||
| (dollars in thousands) (unaudited) | |||||||||||
| Net Operating Income | |||||||||||
| Three Months Ended March 31, | |||||||||||
| 2022 | 2021 | ||||||||||
| Net income | $ | 44,786 | $ | 27,635 | |||||||
| (Subtract) add: | |||||||||||
| Management fees and other revenue | (6,549) | (5,728) | |||||||||
| General and administrative expenses | 13,966 | 11,238 | |||||||||
| Other | 470 | 397 | |||||||||
| Depreciation and amortization | 58,072 | 32,424 | |||||||||
| Interest expense | 22,647 | 16,792 | |||||||||
Equity in earnings of unconsolidated real estate ventures |
(1,494) | (759) | |||||||||
| Acquisition costs | 553 | 292 | |||||||||
| Income tax expense | 848 | 196 | |||||||||
| Gain on sale of self storage properties | (2,134) | — | |||||||||
| Non-operating expense | 112 | 173 | |||||||||
Net Operating Income |
$ | 131,277 | $ | 82,660 | |||||||
| EBITDA and Adjusted EBITDA | |||||||||||
| Three Months Ended March 31, | |||||||||||
| 2022 | 2021 | ||||||||||
| Net income | $ | 44,786 | $ | 27,635 | |||||||
| Add: | |||||||||||
| Depreciation and amortization | 58,072 | 32,424 | |||||||||
Company's share of unconsolidated real estate venture depreciation and amortization |
3,846 | 3,881 | |||||||||
| Interest expense | 22,647 | 16,792 | |||||||||
| Income tax expense | 848 | 196 | |||||||||
EBITDA |
130,199 | 80,928 | |||||||||
| Add (subtract): | |||||||||||
| Acquisition costs | 553 | 292 | |||||||||
| Gain on sale of self storage properties | (2,134) | — | |||||||||
| Equity-based compensation expense | 1,544 | 1,286 | |||||||||
Adjusted EBITDA |
$ | 130,162 | $ | 82,506 | |||||||
11
| Supplemental Schedule 3 | ||||||||||||||||||||||||||||||||||||||||||||||||||||||||
| Portfolio Summary | ||||||||||||||||||||||||||||||||||||||||||||||||||||||||
| As of March 31, 2022 | ||||||||||||||||||||||||||||||||||||||||||||||||||||||||
| (dollars in thousands) (unaudited) | ||||||||||||||||||||||||||||||||||||||||||||||||||||||||
| Wholly-Owned Store Data by State (Consolidated) | Total Operated Store Data by State (Consolidated & Unconsolidated) | |||||||||||||||||||||||||||||||||||||||||||||||||||||||
| State/Territories | Stores | Units | Rentable Square Feet | Occupancy at Period End | State/Territories | Stores | Units | Rentable Square Feet | Occupancy at Period End | |||||||||||||||||||||||||||||||||||||||||||||||
| Texas | 193 | 88,039 | 12,345,448 | 92.4 | % | Texas | 197 | 90,361 | 12,622,012 | 92.4 | % | |||||||||||||||||||||||||||||||||||||||||||||
| California | 86 | 51,320 | 6,483,510 | 95.4 | % | California | 98 | 57,972 | 7,263,144 | 95.3 | % | |||||||||||||||||||||||||||||||||||||||||||||
| Oregon | 70 | 28,792 | 3,597,385 | 90.9 | % | Florida | 85 | 50,236 | 5,566,118 | 94.4 | % | |||||||||||||||||||||||||||||||||||||||||||||
| Georgia | 61 | 27,576 | 3,742,916 | 93.9 | % | Georgia | 72 | 33,708 | 4,614,999 | 94.1 | % | |||||||||||||||||||||||||||||||||||||||||||||
| Florida | 58 | 35,181 | 3,853,447 | 93.7 | % | Oregon | 70 | 28,792 | 3,597,385 | 90.9 | % | |||||||||||||||||||||||||||||||||||||||||||||
| North Carolina | 41 | 19,755 | 2,482,947 | 95.8 | % | North Carolina | 41 | 19,755 | 2,482,947 | 95.8 | % | |||||||||||||||||||||||||||||||||||||||||||||
| Arizona | 33 | 18,151 | 2,096,920 | 91.8 | % | Oklahoma | 39 | 17,616 | 2,449,012 | 95.6 | % | |||||||||||||||||||||||||||||||||||||||||||||
| Oklahoma | 33 | 15,296 | 2,142,397 | 95.8 | % | Arizona | 35 | 19,151 | 2,207,050 | 92.1 | % | |||||||||||||||||||||||||||||||||||||||||||||
| Louisiana | 31 | 13,827 | 1,718,719 | 93.0 | % | Louisiana | 31 | 13,827 | 1,718,719 | 93.0 | % | |||||||||||||||||||||||||||||||||||||||||||||
| Kansas | 23 | 8,598 | 1,187,718 | 91.7 | % | Alabama | 29 | 13,264 | 1,942,269 | 86.5 | % | |||||||||||||||||||||||||||||||||||||||||||||
| Indiana | 21 | 10,987 | 1,440,340 | 94.2 | % | Ohio | 27 | 14,883 | 1,853,459 | 91.7 | % | |||||||||||||||||||||||||||||||||||||||||||||
| Colorado | 20 | 8,821 | 1,092,094 | 92.0 | % | Michigan | 24 | 15,603 | 1,978,523 | 93.5 | % | |||||||||||||||||||||||||||||||||||||||||||||
| Pennsylvania | 19 | 8,318 | 1,028,539 | 92.2 | % | Kansas | 23 | 8,598 | 1,187,718 | 91.7 | % | |||||||||||||||||||||||||||||||||||||||||||||
| Washington | 19 | 6,636 | 871,435 | 89.1 | % | Pennsylvania | 22 | 9,952 | 1,189,309 | 92.0 | % | |||||||||||||||||||||||||||||||||||||||||||||
| Alabama | 15 | 7,743 | 1,116,112 | 80.7 | % | Tennessee | 22 | 11,617 | 1,483,833 | 93.5 | % | |||||||||||||||||||||||||||||||||||||||||||||
| New Hampshire | 15 | 7,109 | 887,101 | 92.5 | % | Indiana | 21 | 10,987 | 1,440,340 | 94.2 | % | |||||||||||||||||||||||||||||||||||||||||||||
| Nevada | 14 | 7,037 | 886,701 | 95.2 | % | New Jersey | 20 | 13,264 | 1,580,130 | 88.8 | % | |||||||||||||||||||||||||||||||||||||||||||||
| Puerto Rico | 14 | 12,395 | 1,338,500 | 94.6 | % | Colorado | 20 | 8,821 | 1,092,094 | 92.0 | % | |||||||||||||||||||||||||||||||||||||||||||||
| Ohio | 13 | 5,504 | 729,037 | 91.7 | % | Washington | 19 | 6,636 | 871,435 | 89.1 | % | |||||||||||||||||||||||||||||||||||||||||||||
| Tennessee | 13 | 6,065 | 777,135 | 92.5 | % | Nevada | 18 | 8,654 | 1,139,164 | 94.5 | % | |||||||||||||||||||||||||||||||||||||||||||||
| Missouri | 11 | 4,935 | 627,985 | 88.8 | % | Massachusetts | 15 | 10,889 | 1,195,043 | 87.0 | % | |||||||||||||||||||||||||||||||||||||||||||||
| New Mexico | 10 | 5,502 | 717,812 | 91.1 | % | New Hampshire | 15 | 7,109 | 887,101 | 92.5 | % | |||||||||||||||||||||||||||||||||||||||||||||
| Illinois | 10 | 6,190 | 697,652 | 94.6 | % | Illinois | 14 | 8,740 | 1,002,864 | 91.9 | % | |||||||||||||||||||||||||||||||||||||||||||||
Other(1)
|
61 | 29,695 | 3,817,068 | 88.1 | % | Puerto Rico | 14 | 12,395 | 1,338,500 | 94.6 | % | |||||||||||||||||||||||||||||||||||||||||||||
Total |
884 | 433,472 | 55,678,918 | 92.6 | % | Minnesota | 12 | 5,735 | 734,345 | 89.5 | % | |||||||||||||||||||||||||||||||||||||||||||||
| Missouri | 11 | 4,935 | 627,985 | 88.8 | % | |||||||||||||||||||||||||||||||||||||||||||||||||||
| New Mexico | 10 | 5,502 | 717,812 | 94.6 | % | |||||||||||||||||||||||||||||||||||||||||||||||||||
Other(2)
|
57 | 28,266 | 3,602,626 | 89.8 | % | |||||||||||||||||||||||||||||||||||||||||||||||||||
| Total | 1,061 | 537,268 | 68,385,936 | 92.7 | % | |||||||||||||||||||||||||||||||||||||||||||||||||||
(1) Other states in NSA's owned portfolio as of March 31, 2022 include Arkansas, Connecticut, Idaho, Iowa, Kentucky, Maryland, Massachusetts, Minnesota, Mississippi, Montana, New Jersey, New York, South Carolina, Utah, Virginia, Wisconsin and Wyoming. | ||||||||||||||||||||||||||||||||||||||||||||||||||||||||
(2) Other states in NSA's operated portfolio as of March 31, 2022 include Arkansas, Connecticut, Delaware, Idaho, Iowa, Kentucky, Maryland, Mississippi, Montana, New York, Rhode Island, South Carolina, Utah, Virginia, Wisconsin and Wyoming. | ||||||||||||||||||||||||||||||||||||||||||||||||||||||||
12
| Supplemental Schedule 3 (continued) | ||||||||||||||||||||||||||||||||||||||||||||
| Portfolio Summary | ||||||||||||||||||||||||||||||||||||||||||||
| (dollars in thousands) (unaudited) | ||||||||||||||||||||||||||||||||||||||||||||
2022 Acquisition Activity |
||||||||||||||||||||||||||||||||||||||||||||
| Self Storage Properties Acquired During the Quarter Ended: |
Summary of Investment | |||||||||||||||||||||||||||||||||||||||||||
| Stores | Units | Rentable Square Feet | Cash and Acquisition Costs | Value of OP Equity | Other Liabilities | Total | ||||||||||||||||||||||||||||||||||||||
March 31, 2022(3)
|
12 | 5,002 | 678,383 | $ | 76,027 | $ | 16,576 | $ | 332 | $ | 92,935 | |||||||||||||||||||||||||||||||||
2022 Disposition & Divestiture Activity |
||||||||||||||||||||||||||
| Dispositions Closed During the Quarter Ended: | Stores | Units | Rentable Square Feet | Proceeds | ||||||||||||||||||||||
March 31, 2022(4)
|
1 | 432 | 64,750 | $ | 6,531 | |||||||||||||||||||||
(3) NSA acquired self storage properties located in Alabama (1), Connecticut (1), Florida (1), Georgia (1), Minnesota (1), New Mexico (4), Pennsylvania (2) and Virginia (1). | ||||||||||||||||||||
(4) NSA disposed of a self storage property located in Texas in 2022. | ||||||||||||||||||||
13
| Supplemental Schedule 4 | |||||||||||||||||||||||||||||||||||||||||||||||||||||||||||||||||||||||
| Debt and Equity Capitalization | BBB+ Rated | ||||||||||||||||||||||||||||||||||||||||||||||||||||||||||||||||||||||
| As of March 31, 2022 | (with Stable Outlook) | ||||||||||||||||||||||||||||||||||||||||||||||||||||||||||||||||||||||
| (unaudited) | by Kroll Bond Rating Agency | ||||||||||||||||||||||||||||||||||||||||||||||||||||||||||||||||||||||
Debt Summary (dollars in thousands)
|
|||||||||||||||||||||||||||||||||||||||||||||||||||||||||||||||||||||||
Effective Interest Rate(1)
|
Basis of Rate | Maturity Date | 2022 | 2023 | 2024 | 2025 | 2026 | 2027 | 2028 | Thereafter | Total | ||||||||||||||||||||||||||||||||||||||||||||||||||||||||||||
| Credit Facility: | |||||||||||||||||||||||||||||||||||||||||||||||||||||||||||||||||||||||
Revolving line of credit |
1.70% |
Variable(2)
|
January 2024 | $ | — | $ | — | $ | 425,000 | $ | — | $ | — | $ | — | $ | — | $ | — | $ | 425,000 | ||||||||||||||||||||||||||||||||||||||||||||||||||
Term loan - Tranche A |
3.69% | Swapped To Fixed | January 2023 | — | 125,000 | — | — | — | — | — | — | 125,000 | |||||||||||||||||||||||||||||||||||||||||||||||||||||||||||
Term loan - Tranche B |
2.86% | Swapped To Fixed | July 2024 | — | — | 250,000 | — | — | — | — | — | 250,000 | |||||||||||||||||||||||||||||||||||||||||||||||||||||||||||
Term loan - Tranche C |
2.86% | Swapped To Fixed | January 2025 | — | — | — | 225,000 | — | — | — | — | 225,000 | |||||||||||||||||||||||||||||||||||||||||||||||||||||||||||
Term loan - Tranche D |
3.07% | Swapped To Fixed | July 2026 | — | — | — | — | 175,000 | — | — | — | 175,000 | |||||||||||||||||||||||||||||||||||||||||||||||||||||||||||
Term loan - Tranche E |
1.60% | Variable | March 2027 | — | — | — | — | — | 125,000 | — | — | 125,000 | |||||||||||||||||||||||||||||||||||||||||||||||||||||||||||
| Term loan facility - 2023 | 2.83% | Swapped To Fixed | June 2023 | — | 175,000 | — | — | — | — | — | — | 175,000 | |||||||||||||||||||||||||||||||||||||||||||||||||||||||||||
| Term loan facility - 2028 | 4.62% | Swapped To Fixed | December 2028 | — | — | — | — | — | — | 75,000 | — | 75,000 | |||||||||||||||||||||||||||||||||||||||||||||||||||||||||||
| Term loan facility - 2029 | 4.27% | Swapped To Fixed | April 2029 | — | — | — | — | — | — | — | 100,000 | 100,000 | |||||||||||||||||||||||||||||||||||||||||||||||||||||||||||
| 2026 Senior Unsecured Notes | 2.16% | Fixed | May 2026 | — | — | — | — | 35,000 | — | — | — | 35,000 | |||||||||||||||||||||||||||||||||||||||||||||||||||||||||||
| 2029 Senior Unsecured Notes | 3.98% | Fixed | August 2029 | — | — | — | — | — | — | — | 100,000 | 100,000 | |||||||||||||||||||||||||||||||||||||||||||||||||||||||||||
| August 2030 Senior Unsecured Notes | 2.99% | Fixed | August 2030 | — | — | — | — | — | — | — | 150,000 | 150,000 | |||||||||||||||||||||||||||||||||||||||||||||||||||||||||||
| November 2030 Senior Unsecured Notes | 2.72% | Fixed | November 2030 | — | — | — | — | — | — | — | 75,000 | 75,000 | |||||||||||||||||||||||||||||||||||||||||||||||||||||||||||
| May 2031 Senior Unsecured Notes | 3.00% | Fixed | May 2031 | — | — | — | — | — | — | — | 90,000 | 90,000 | |||||||||||||||||||||||||||||||||||||||||||||||||||||||||||
| August 2031 Senior Unsecured Notes | 4.08% | Fixed | August 2031 | — | — | — | — | — | — | — | 50,000 | 50,000 | |||||||||||||||||||||||||||||||||||||||||||||||||||||||||||
| November 2031 Senior Unsecured Notes | 2.81% | Fixed | November 2031 | — | — | — | — | — | — | — | 175,000 | 175,000 | |||||||||||||||||||||||||||||||||||||||||||||||||||||||||||
| 2032 Senior Unsecured Notes | 3.09% | Fixed | August 2032 | — | — | — | — | — | — | — | 100,000 | 100,000 | |||||||||||||||||||||||||||||||||||||||||||||||||||||||||||
| May 2033 Senior Unsecured Notes | 3.10% | Fixed | May 2033 | — | — | — | — | — | — | — | 55,000 | 55,000 | |||||||||||||||||||||||||||||||||||||||||||||||||||||||||||
| November 2033 Senior Unsecured Notes | 2.96% | Fixed | November 2033 | — | — | — | — | — | — | — | 125,000 | 125,000 | |||||||||||||||||||||||||||||||||||||||||||||||||||||||||||
| 2036 Senior Unsecured Notes | 3.06% | Fixed | November 2036 | — | — | — | — | — | — | — | 75,000 | 75,000 | |||||||||||||||||||||||||||||||||||||||||||||||||||||||||||
| Fixed rate mortgages payable | 3.82% | Fixed | April 2023 - October 2031 | — | 76,617 | 20,084 | — | — | 84,900 | 88,000 | 33,259 | 302,860 | |||||||||||||||||||||||||||||||||||||||||||||||||||||||||||
Total Principal/Weighted Average |
2.95% | 5.4 years | $ | — | $ | 376,617 | $ | 695,084 | $ | 225,000 | $ | 210,000 | $ | 209,900 | $ | 163,000 | $ | 1,128,259 | $ | 3,007,860 | |||||||||||||||||||||||||||||||||||||||||||||||||||
Unamortized debt issuance costs and debt premium, net |
(8,109) | ||||||||||||||||||||||||||||||||||||||||||||||||||||||||||||||||||||||
Total Debt |
$ | 2,999,751 | |||||||||||||||||||||||||||||||||||||||||||||||||||||||||||||||||||||
(1) Effective interest rate incorporates the stated rate plus the impact of interest rate cash flow hedges and discount and premium amortization, if applicable. | |||||||||||||||||||||||||||||||||||||||||||||||||||||||||||||||||||||||
(2) For the $650 million revolving line of credit, the effective interest rate is calculated based on one month LIBOR plus an applicable margin of 1.25% and excludes fees which range from 0.15% to 0.20% for unused borrowings. | |||||||||||||||||||||||||||||||||||||||||||||||||||||||||||||||||||||||
14
| Supplemental Schedule 4 (continued) | |||||||||||||||||
| Debt and Equity Capitalization | |||||||||||||||||
| As of March 31, 2022 | |||||||||||||||||
| (unaudited) | |||||||||||||||||
| Debt Ratios | |||||||||||||||||
Covenant |
Amount |
||||||||||||||||
| Net Debt to Annualized Current Quarter Adjusted EBITDA | n/a | 5.7x | |||||||||||||||
Trailing Twelve Month Fixed Charge Coverage Ratio |
> 1.5x | 4.3x | |||||||||||||||
| Total Leverage Ratio | < 60.0% | 39.1% | |||||||||||||||
| Preferred Shares and Units | |||||||||||
| Outstanding | |||||||||||
| 6.000% Series A cumulative redeemable preferred shares of beneficial interest | 8,744,935 | ||||||||||
| 6.000% Series A-1 cumulative redeemable preferred units | 984,861 | ||||||||||
| Common Shares and Units | |||||||||||
| Outstanding | If Converted | ||||||||||
| Common shares of beneficial interest | 91,433,124 | 91,433,124 | |||||||||
| Restricted common shares | 28,596 | 28,596 | |||||||||
Total shares outstanding |
91,461,720 | 91,461,720 | |||||||||
| Operating partnership units | 35,385,718 | 35,385,718 | |||||||||
DownREIT operating partnership unit equivalents |
1,924,918 | 1,924,918 | |||||||||
Total operating partnership units |
37,310,636 | 37,310,636 | |||||||||
Long-term incentive plan units(3)
|
516,536 | 516,536 | |||||||||
Total shares and Class A equivalents outstanding |
129,288,892 | 129,288,892 | |||||||||
Subordinated performance units(4)
|
7,853,367 | 12,800,988 | |||||||||
DownREIT subordinated performance unit equivalents(4)
|
4,337,111 | 7,069,491 | |||||||||
Total subordinated partnership units |
12,190,478 | 19,870,479 | |||||||||
Total common shares and units outstanding |
141,479,370 | 149,159,371 | |||||||||
(3) Balances exclude 252,894 long-term incentive plan ("LTIP") units which only vest and participate in dividend distributions upon the future contribution of properties from the PROs or the completion of expansion projects. | |||||||||||
(4) If converted balance assumes that each subordinated performance unit (including each DownREIT subordinated performance unit) is convertible into OP units, notwithstanding the two-year lock-out period on conversions for certain series of subordinated performance units, and that each subordinated performance unit would on average convert on a hypothetical basis into an estimated 1.63 OP units based on historical financial information for the trailing twelve months ended March 31, 2022. The hypothetical conversions are calculated by dividing the average cash available for distribution, or CAD, per subordinated performance unit by 110% of the CAD per OP unit over the same period. The Company anticipates that as CAD grows over time, the conversion ratio will also grow, including to levels that may exceed these amounts. | |||||||||||
15
| Supplemental Schedule 5 | ||||||||||||||
| Summarized Information for Unconsolidated Real Estate Ventures | ||||||||||||||
| (dollars in thousands) (unaudited) | ||||||||||||||
| Combined Balance Sheet Information | ||||||||||||||
Total Ventures at 100%(1)
|
March 31, 2022 | December 31, 2021 | ||||||||||||
| ASSETS | ||||||||||||||
| Self storage properties, net | $ | 1,727,229 | $ | 1,741,538 | ||||||||||
| Other assets | 26,309 | 23,562 | ||||||||||||
| Total assets | $ | 1,753,538 | $ | 1,765,100 | ||||||||||
| LIABILITIES AND EQUITY | ||||||||||||||
| Debt financing | $ | 1,001,608 | $ | 1,001,378 | ||||||||||
| Other liabilities | 22,321 | 19,493 | ||||||||||||
| Equity | 729,609 | 744,229 | ||||||||||||
| Total liabilities and equity | $ | 1,753,538 | $ | 1,765,100 | ||||||||||
| Combined Operating Information | ||||||||||||||
| Three Months Ended March 31, 2022 | ||||||||||||||
Total Ventures at 100%(1)
|
NSA Proportionate Share (Ventures at 25%)(2)
|
|||||||||||||
| Total revenue | $ | 48,998 | $ | 12,250 | ||||||||||
| Property operating expenses | 13,809 | 3,452 | ||||||||||||
| Net operating income | 35,189 | 8,798 | ||||||||||||
Supervisory, administrative and other expenses |
(3,202) | (801) | ||||||||||||
| Depreciation and amortization | (15,382) | (3,846) | ||||||||||||
| Interest expense | (10,410) | (2,603) | ||||||||||||
| Acquisition and other expenses | (274) | (69) | ||||||||||||
| Net income | $ | 5,921 | $ | 1,479 | ||||||||||
| Add (subtract): | ||||||||||||||
Equity in earnings adjustments related to amortization of basis differences |
15 | |||||||||||||
Company's share of unconsolidated real estate venture real estate depreciation and amortization |
3,846 | |||||||||||||
Company's share of FFO and Core FFO from unconsolidated real estate ventures |
$ | 5,340 | ||||||||||||
(1) Values represent entire unconsolidated real estate ventures at 100%, not NSA's proportionate share. NSA's ownership in each of the unconsolidated real estate ventures is 25%. | |||||||||||||||||||||||
(2) NSA's proportionate share of its unconsolidated real estate ventures is derived by applying NSA's 25% ownership interest to each line item in the GAAP financial statements of the unconsolidated real estate ventures to calculate NSA's share of that line item. NSA believes this information offers insights into the financial performance of the Company, although the presentation of such information, and its combination with NSA's consolidated results, may not accurately depict the legal and economic implications of holding a noncontrolling interest in the unconsolidated real estate ventures. The operating agreements of the unconsolidated real estate ventures provide for the distribution of net cash flow to the unconsolidated real estate ventures' investors no less than monthly, generally in proportion to the investors’ respective ownership interests, subject to a promoted distribution to NSA upon the achievement of certain performance benchmarks by the non-NSA investor. | |||||||||||||||||||||||
16
| Supplemental Schedule 6 | |||||||||||||||||||||||||||||||||||||||||||||||||||||||||||||||||||||||||||||
| Same Store Performance Summary By State | |||||||||||||||||||||||||||||||||||||||||||||||||||||||||||||||||||||||||||||
| (dollars in thousands, except per square foot data) (unaudited) | |||||||||||||||||||||||||||||||||||||||||||||||||||||||||||||||||||||||||||||
| Three Months Ended March 31, 2022 compared to Three Months Ended March 31, 2021 | |||||||||||||||||||||||||||||||||||||||||||||||||||||||||||||||||||||||||||||
| Total Revenue | Property Operating Expenses | Net Operating Income | Net Operating Income Margin | ||||||||||||||||||||||||||||||||||||||||||||||||||||||||||||||||||||||||||
| State | Stores | 1Q 2022 | 1Q 2021 | Growth | 1Q 2022 | 1Q 2021 | Growth | 1Q 2022 | 1Q 2021 | Growth | 1Q 2022 | 1Q 2021 | Growth | ||||||||||||||||||||||||||||||||||||||||||||||||||||||||||||||||
| Texas | 113 | $ | 20,537 | $ | 17,411 | 18.0 | % | $ | 6,414 | $ | 6,306 | 1.7 | % | $ | 14,123 | $ | 11,105 | 27.2 | % | 68.8 | % | 63.8 | % | 5.0 | % | ||||||||||||||||||||||||||||||||||||||||||||||||||||
| California | 81 | 24,246 | 20,772 | 16.7 | % | 5,501 | 5,430 | 1.3 | % | 18,745 | 15,342 | 22.2 | % | 77.3 | % | 73.9 | % | 3.4 | % | ||||||||||||||||||||||||||||||||||||||||||||||||||||||||||
| Oregon | 63 | 12,850 | 11,221 | 14.5 | % | 2,829 | 2,782 | 1.7 | % | 10,021 | 8,439 | 18.7 | % | 78.0 | % | 75.2 | % | 2.8 | % | ||||||||||||||||||||||||||||||||||||||||||||||||||||||||||
| Florida | 48 | 13,693 | 11,513 | 18.9 | % | 3,402 | 3,215 | 5.8 | % | 10,291 | 8,298 | 24.0 | % | 75.2 | % | 72.1 | % | 3.1 | % | ||||||||||||||||||||||||||||||||||||||||||||||||||||||||||
| Georgia | 46 | 7,874 | 6,494 | 21.3 | % | 2,070 | 2,047 | 1.1 | % | 5,804 | 4,447 | 30.5 | % | 73.7 | % | 68.5 | % | 5.2 | % | ||||||||||||||||||||||||||||||||||||||||||||||||||||||||||
| North Carolina | 34 | 6,299 | 5,439 | 15.8 | % | 1,491 | 1,462 | 2.0 | % | 4,808 | 3,977 | 20.9 | % | 76.3 | % | 73.1 | % | 3.2 | % | ||||||||||||||||||||||||||||||||||||||||||||||||||||||||||
| Oklahoma | 32 | 4,768 | 4,214 | 13.1 | % | 1,283 | 1,229 | 4.4 | % | 3,485 | 2,985 | 16.8 | % | 73.1 | % | 70.8 | % | 2.3 | % | ||||||||||||||||||||||||||||||||||||||||||||||||||||||||||
| Arizona | 30 | 7,119 | 6,086 | 17.0 | % | 1,676 | 1,612 | 4.0 | % | 5,443 | 4,474 | 21.7 | % | 76.5 | % | 73.5 | % | 3.0 | % | ||||||||||||||||||||||||||||||||||||||||||||||||||||||||||
| Louisiana | 26 | 4,361 | 3,782 | 15.3 | % | 1,184 | 1,202 | (1.5) | % | 3,177 | 2,580 | 23.1 | % | 72.9 | % | 68.2 | % | 4.7 | % | ||||||||||||||||||||||||||||||||||||||||||||||||||||||||||
| Kansas | 17 | 2,613 | 2,346 | 11.4 | % | 914 | 875 | 4.5 | % | 1,699 | 1,471 | 15.5 | % | 65.0 | % | 62.7 | % | 2.3 | % | ||||||||||||||||||||||||||||||||||||||||||||||||||||||||||
| Colorado | 16 | 2,666 | 2,319 | 15.0 | % | 617 | 754 | (18.2) | % | 2,049 | 1,565 | 30.9 | % | 76.9 | % | 67.5 | % | 9.4 | % | ||||||||||||||||||||||||||||||||||||||||||||||||||||||||||
| Indiana | 16 | 3,121 | 2,717 | 14.9 | % | 955 | 845 | 13.0 | % | 2,166 | 1,872 | 15.7 | % | 69.4 | % | 68.9 | % | 0.5 | % | ||||||||||||||||||||||||||||||||||||||||||||||||||||||||||
| Washington | 16 | 2,607 | 2,233 | 16.7 | % | 676 | 603 | 12.1 | % | 1,931 | 1,630 | 18.5 | % | 74.1 | % | 73.0 | % | 1.1 | % | ||||||||||||||||||||||||||||||||||||||||||||||||||||||||||
| Nevada | 13 | 2,969 | 2,532 | 17.3 | % | 673 | 636 | 5.8 | % | 2,296 | 1,896 | 21.1 | % | 77.3 | % | 74.9 | % | 2.4 | % | ||||||||||||||||||||||||||||||||||||||||||||||||||||||||||
| New Hampshire | 11 | 2,354 | 2,044 | 15.2 | % | 675 | 674 | 0.1 | % | 1,679 | 1,370 | 22.6 | % | 71.3 | % | 67.0 | % | 4.3 | % | ||||||||||||||||||||||||||||||||||||||||||||||||||||||||||
Other(1)
|
69 | 14,542 | 12,604 | 15.4 | % | 3,957 | 3,612 | 9.6 | % | 10,585 | 8,992 | 17.7 | % | 72.8 | % | 71.3 | % | 1.5 | % | ||||||||||||||||||||||||||||||||||||||||||||||||||||||||||
| Total/Weighted Average | 631 | $ | 132,619 | $ | 113,727 | 16.6 | % | $ | 34,317 | $ | 33,284 | 3.1 | % | $ | 98,302 | $ | 80,443 | 22.2 | % | 74.1 | % | 70.7 | % | 3.4 | % | ||||||||||||||||||||||||||||||||||||||||||||||||||||
2021 Same Store Pool(2)
|
555 | $ | 117,300 | $ | 100,841 | 16.3 | % | $ | 29,966 | $ | 28,728 | 4.3 | % | $ | 87,334 | $ | 72,113 | 21.1 | % | 74.5 | % | 71.5 | % | 3.0 | % | ||||||||||||||||||||||||||||||||||||||||||||||||||||
2020 Same Store Pool(3)
|
493 | $ | 104,378 | $ | 89,791 | 16.2 | % | $ | 26,571 | $ | 25,384 | 4.7 | % | $ | 77,807 | $ | 64,407 | 20.8 | % | 74.5 | % | 71.7 | % | 2.8 | % | ||||||||||||||||||||||||||||||||||||||||||||||||||||
| (1) Other states and territories in NSA's same store portfolio include Alabama, Connecticut, Idaho, Illinois, Kentucky, Maryland, Massachusetts, Minnesota, Mississippi, Missouri, New Jersey, New Mexico, New York, Ohio, Pennsylvania, South Carolina, Tennessee, Virginia and Puerto Rico. | ||||||||||||||||||||
| (2) Represents the subset of properties included in the 2022 same store pool that were in NSA's same store pool reported in 2021. | ||||||||||||||||||||
| (3) Represents the subset of properties included in the 2022 same store pool that were in NSA's same store pool reported in 2020. | ||||||||||||||||||||
17
| Supplemental Schedule 6 (continued) | ||||||||||||||||||||||||||||||||||||||||||||||||||||||||||||||
| Same Store Performance Summary By State | ||||||||||||||||||||||||||||||||||||||||||||||||||||||||||||||
| (dollars in thousands, except per square foot data) (unaudited) | ||||||||||||||||||||||||||||||||||||||||||||||||||||||||||||||
| Three Months Ended March 31, 2022 compared to Three Months Ended March 31, 2021 | ||||||||||||||||||||||||||||||||||||||||||||||||||||||||||||||
| Rentable Square Feet | Occupancy at Period End | Average Occupancy | Average Annualized Rental Revenue per Occupied Square Foot | |||||||||||||||||||||||||||||||||||||||||||||||||||||||||||
| State | Units | 1Q 2022 | 1Q 2021 | Growth | 1Q 2022 | 1Q 2021 | Growth | 1Q 2022 | 1Q 2021 | Growth | ||||||||||||||||||||||||||||||||||||||||||||||||||||
| Texas | 47,714 | 6,757,803 | 95.5 | % | 91.9 | % | 3.6 | % | 95.3 | % | 90.3 | % | 5.0 | % | $ | 12.33 | $ | 11.03 | 11.8 | % | ||||||||||||||||||||||||||||||||||||||||||
| California | 48,409 | 6,094,703 | 95.6 | % | 97.0 | % | (1.4) | % | 96.2 | % | 96.2 | % | — | 15.84 | 13.56 | 16.8 | % | |||||||||||||||||||||||||||||||||||||||||||||
| Oregon | 25,213 | 3,197,875 | 92.5 | % | 91.2 | % | 1.3 | % | 91.7 | % | 89.7 | % | 2.0 | % | 17.16 | 15.44 | 11.1 | % | ||||||||||||||||||||||||||||||||||||||||||||
| Florida | 29,173 | 3,243,987 | 94.4 | % | 93.9 | % | 0.5 | % | 94.7 | % | 92.9 | % | 1.8 | % | 17.34 | 14.91 | 16.3 | % | ||||||||||||||||||||||||||||||||||||||||||||
| Georgia | 19,764 | 2,654,245 | 96.2 | % | 93.7 | % | 2.5 | % | 96.5 | % | 92.4 | % | 4.1 | % | 11.96 | 10.24 | 16.8 | % | ||||||||||||||||||||||||||||||||||||||||||||
| North Carolina | 15,737 | 1,952,945 | 96.9 | % | 95.9 | % | 1.0 | % | 97.0 | % | 94.7 | % | 2.3 | % | 12.88 | 11.34 | 13.6 | % | ||||||||||||||||||||||||||||||||||||||||||||
| Oklahoma | 14,944 | 2,096,997 | 95.8 | % | 93.1 | % | 2.7 | % | 95.2 | % | 92.3 | % | 2.9 | % | 9.31 | 8.48 | 9.8 | % | ||||||||||||||||||||||||||||||||||||||||||||
| Arizona | 16,369 | 1,922,817 | 93.4 | % | 94.4 | % | (1.0) | % | 93.9 | % | 92.6 | % | 1.3 | % | 15.36 | 13.29 | 15.6 | % | ||||||||||||||||||||||||||||||||||||||||||||
| Louisiana | 12,354 | 1,539,374 | 94.2 | % | 87.9 | % | 6.3 | % | 93.8 | % | 86.5 | % | 7.3 | % | 11.79 | 11.10 | 6.2 | % | ||||||||||||||||||||||||||||||||||||||||||||
| Kansas | 5,806 | 810,228 | 94.7 | % | 92.8 | % | 1.9 | % | 93.6 | % | 90.4 | % | 3.2 | % | 13.09 | 11.72 | 11.7 | % | ||||||||||||||||||||||||||||||||||||||||||||
| Colorado | 6,725 | 838,601 | 94.2 | % | 94.8 | % | (0.6) | % | 93.5 | % | 92.5 | % | 1.0 | % | 13.33 | 11.72 | 13.7 | % | ||||||||||||||||||||||||||||||||||||||||||||
| Indiana | 8,741 | 1,133,893 | 96.3 | % | 95.4 | % | 0.9 | % | 95.6 | % | 94.1 | % | 1.5 | % | 11.25 | 9.92 | 13.4 | % | ||||||||||||||||||||||||||||||||||||||||||||
| Washington | 5,390 | 716,603 | 92.3 | % | 89.3 | % | 3.0 | % | 91.7 | % | 88.7 | % | 3.0 | % | 15.50 | 13.76 | 12.6 | % | ||||||||||||||||||||||||||||||||||||||||||||
| Nevada | 6,732 | 842,695 | 95.5 | % | 94.9 | % | 0.6 | % | 94.9 | % | 94.1 | % | 0.8 | % | 14.21 | 12.11 | 17.3 | % | ||||||||||||||||||||||||||||||||||||||||||||
| New Hampshire | 5,035 | 617,781 | 93.3 | % | 93.3 | % | — | 94.1 | % | 93.0 | % | 1.1 | % | 15.83 | 13.86 | 14.2 | % | |||||||||||||||||||||||||||||||||||||||||||||
Other(1)
|
33,680 | 4,146,317 | 93.5 | % | 92.2 | % | 1.3 | % | 93.2 | % | 91.0 | % | 2.2 | % | 14.99 | 13.46 | 11.4 | % | ||||||||||||||||||||||||||||||||||||||||||||
| Total/Weighted Average | 301,786 | 38,566,864 | 94.8 | % | 93.4 | % | 1.4 | % | 94.7 | % | 92.2 | % | 2.5 | % | $ | 14.10 | $ | 12.43 | 13.4 | % | ||||||||||||||||||||||||||||||||||||||||||
2021 Same Store Pool(2)
|
266,883 | 33,768,298 | 94.9 | % | 93.8 | % | 1.1 | % | 94.8 | % | 92.5 | % | 2.3 | % | $ | 14.25 | $ | 12.54 | 13.6 | % | ||||||||||||||||||||||||||||||||||||||||||
2020 Same Store Pool(3)
|
237,747 | 30,007,460 | 94.9 | % | 94.0 | % | 0.9 | % | 94.8 | % | 92.7 | % | 2.1 | % | $ | 14.20 | $ | 12.48 | 13.8 | % | ||||||||||||||||||||||||||||||||||||||||||
| (1) Other states and territories in NSA's same store portfolio include Alabama, Connecticut, Idaho, Illinois, Kentucky, Maryland, Massachusetts, Minnesota, Mississippi, Missouri, New Jersey, New Mexico, New York, Ohio, Pennsylvania, South Carolina, Tennessee, Virginia and Puerto Rico. | ||||||||||||||||||||
| (2) Represents the subset of properties included in the 2022 same store pool that were in NSA's same store pool reported in 2021. | ||||||||||||||||||||
| (3) Represents the subset of properties included in the 2022 same store pool that were in NSA's same store pool reported in 2020. | ||||||||||||||||||||
18
| Supplemental Schedule 7 | |||||||||||||||||||||||||||||||||||||||||||||||||||||||||||||||||||||||||||||
Same Store Performance Summary By MSA(1)
|
|||||||||||||||||||||||||||||||||||||||||||||||||||||||||||||||||||||||||||||
| (dollars in thousands, except per square foot data) (unaudited) | |||||||||||||||||||||||||||||||||||||||||||||||||||||||||||||||||||||||||||||
| Three Months Ended March 31, 2022 compared to Three Months Ended March 31, 2021 | |||||||||||||||||||||||||||||||||||||||||||||||||||||||||||||||||||||||||||||
| Total Revenue | Property Operating Expenses | Net Operating Income | Net Operating Income Margin | ||||||||||||||||||||||||||||||||||||||||||||||||||||||||||||||||||||||||||
MSA(1)
|
Stores | 1Q 2022 | 1Q 2021 | Growth | 1Q 2022 | 1Q 2021 | Growth | 1Q 2022 | 1Q 2021 | Growth | 1Q 2022 | 1Q 2021 | Growth | ||||||||||||||||||||||||||||||||||||||||||||||||||||||||||||||||
| Portland-Vancouver-Hillsboro, OR-WA | 47 | $ | 9,504 | $ | 8,360 | 13.7 | % | $ | 2,209 | $ | 2,095 | 5.4 | % | $ | 7,295 | $ | 6,265 | 16.4 | % | 76.8 | % | 74.9 | % | 1.9 | % | ||||||||||||||||||||||||||||||||||||||||||||||||||||
| Riverside-San Bernardino-Ontario, CA | 46 | 12,361 | 10,388 | 19.0 | % | 2,538 | 2,459 | 3.2 | % | 9,823 | 7,929 | 23.9 | % | 79.5 | % | 76.3 | % | 3.2 | % | ||||||||||||||||||||||||||||||||||||||||||||||||||||||||||
| Atlanta-Sandy Springs-Roswell, GA | 30 | 5,521 | 4,510 | 22.4 | % | 1,420 | 1,385 | 2.5 | % | 4,101 | 3,125 | 31.2 | % | 74.3 | % | 69.3 | % | 5.0 | % | ||||||||||||||||||||||||||||||||||||||||||||||||||||||||||
| Phoenix-Mesa-Scottsdale, AZ | 23 | 5,687 | 4,881 | 16.5 | % | 1,329 | 1,277 | 4.1 | % | 4,358 | 3,604 | 20.9 | % | 76.6 | % | 73.8 | % | 2.8 | % | ||||||||||||||||||||||||||||||||||||||||||||||||||||||||||
| McAllen-Edinburg-Mission, TX | 20 | 4,176 | 3,510 | 19.0 | % | 1,019 | 1,053 | (3.2) | % | 3,157 | 2,457 | 28.5 | % | 75.6 | % | 70.0 | % | 5.6 | % | ||||||||||||||||||||||||||||||||||||||||||||||||||||||||||
| Oklahoma City, OK | 19 | 2,864 | 2,483 | 15.3 | % | 802 | 752 | 6.6 | % | 2,062 | 1,731 | 19.1 | % | 72.0 | % | 69.7 | % | 2.3 | % | ||||||||||||||||||||||||||||||||||||||||||||||||||||||||||
| Houston-The Woodlands-Sugar Land, TX | 18 | 3,725 | 3,232 | 15.3 | % | 1,258 | 1,234 | 1.9 | % | 2,467 | 1,998 | 23.5 | % | 66.2 | % | 61.8 | % | 4.4 | % | ||||||||||||||||||||||||||||||||||||||||||||||||||||||||||
| Dallas-Fort Worth-Arlington, TX | 17 | 3,027 | 2,610 | 16.0 | % | 1,099 | 1,044 | 5.3 | % | 1,928 | 1,566 | 23.1 | % | 63.7 | % | 60.0 | % | 3.7 | % | ||||||||||||||||||||||||||||||||||||||||||||||||||||||||||
| Brownsville-Harlingen, TX | 16 | 2,585 | 2,152 | 20.1 | % | 647 | 679 | (4.7) | % | 1,938 | 1,473 | 31.6 | % | 75.0 | % | 68.4 | % | 6.6 | % | ||||||||||||||||||||||||||||||||||||||||||||||||||||||||||
| Indianapolis-Carmel-Anderson, IN | 16 | 3,121 | 2,717 | 14.9 | % | 955 | 845 | 13.0 | % | 2,166 | 1,872 | 15.7 | % | 69.4 | % | 68.9 | % | 0.5 | % | ||||||||||||||||||||||||||||||||||||||||||||||||||||||||||
| Los Angeles-Long Beach-Anaheim, CA | 14 | 5,868 | 5,196 | 12.9 | % | 1,322 | 1,365 | (3.2) | % | 4,546 | 3,831 | 18.7 | % | 77.5 | % | 73.7 | % | 3.8 | % | ||||||||||||||||||||||||||||||||||||||||||||||||||||||||||
| New Orleans-Metairie, LA | 13 | 2,426 | 2,088 | 16.2 | % | 604 | 608 | (0.7) | % | 1,822 | 1,480 | 23.1 | % | 75.1 | % | 70.9 | % | 4.2 | % | ||||||||||||||||||||||||||||||||||||||||||||||||||||||||||
| North Port-Sarasota-Bradenton, FL | 13 | 4,140 | 3,393 | 22.0 | % | 981 | 937 | 4.7 | % | 3,159 | 2,456 | 28.6 | % | 76.3 | % | 72.4 | % | 3.9 | % | ||||||||||||||||||||||||||||||||||||||||||||||||||||||||||
| Tulsa, OK | 13 | 1,904 | 1,731 | 10.0 | % | 481 | 477 | 0.8 | % | 1,423 | 1,254 | 13.5 | % | 74.7 | % | 72.4 | % | 2.3 | % | ||||||||||||||||||||||||||||||||||||||||||||||||||||||||||
| Las Vegas-Henderson-Paradise, NV | 12 | 2,837 | 2,408 | 17.8 | % | 639 | 603 | 6.0 | % | 2,198 | 1,805 | 21.8 | % | 77.5 | % | 75.0 | % | 2.5 | % | ||||||||||||||||||||||||||||||||||||||||||||||||||||||||||
| Colorado Springs, CO | 11 | 1,563 | 1,356 | 15.3 | % | 263 | 455 | (42.2) | % | 1,300 | 901 | 44.3 | % | 83.2 | % | 66.4 | % | 16.8 | % | ||||||||||||||||||||||||||||||||||||||||||||||||||||||||||
| Kansas City, MO-KS | 11 | 1,845 | 1,690 | 9.2 | % | 687 | 636 | 8.0 | % | 1,158 | 1,054 | 9.9 | % | 62.8 | % | 62.4 | % | 0.4 | % | ||||||||||||||||||||||||||||||||||||||||||||||||||||||||||
| San Antonio-New Braunfels, TX | 11 | 2,017 | 1,763 | 14.4 | % | 754 | 715 | 5.5 | % | 1,263 | 1,048 | 20.5 | % | 62.6 | % | 59.4 | % | 3.2 | % | ||||||||||||||||||||||||||||||||||||||||||||||||||||||||||
| Other MSAs | 281 | 57,448 | 49,259 | 16.6 | % | 15,310 | 14,665 | 4.4 | % | 42,138 | 34,594 | 21.8 | % | 73.3 | % | 70.2 | % | 3.1 | % | ||||||||||||||||||||||||||||||||||||||||||||||||||||||||||
| Total/Weighted Average | 631 | $ | 132,619 | $ | 113,727 | 16.6 | % | $ | 34,317 | $ | 33,284 | 3.1 | % | $ | 98,302 | $ | 80,443 | 22.2 | % | 74.1 | % | 70.7 | % | 3.4 | % | ||||||||||||||||||||||||||||||||||||||||||||||||||||
2021 Same Store Pool(2)
|
555 | $ | 117,300 | $ | 100,841 | 16.3 | % | $ | 29,966 | $ | 28,728 | 4.3 | % | $ | 87,334 | $ | 72,113 | 21.1 | % | 74.5 | % | 71.5 | % | 3.0 | % | ||||||||||||||||||||||||||||||||||||||||||||||||||||
2020 Same Store Pool(3)
|
493 | $ | 104,378 | $ | 89,791 | 16.2 | % | $ | 26,571 | $ | 25,384 | 4.7 | % | $ | 77,807 | $ | 64,407 | 20.8 | % | 74.5 | % | 71.7 | % | 2.8 | % | ||||||||||||||||||||||||||||||||||||||||||||||||||||
(1) MSA (Metropolitan Statistical Area) as defined by the United States Census Bureau. | ||||||||||||||||||||
| (2) Represents the subset of properties included in the 2022 same store pool that were in NSA's same store pool reported in 2021. | ||||||||||||||||||||
| (3) Represents the subset of properties included in the 2022 same store pool that were in NSA's same store pool reported in 2020. | ||||||||||||||||||||
19
| Supplemental Schedule 7 (continued) | ||||||||||||||||||||||||||||||||||||||||||||||||||||||||||||||
Same Store Performance Summary By MSA(1)
|
||||||||||||||||||||||||||||||||||||||||||||||||||||||||||||||
| (dollars in thousands, except per square foot data) (unaudited) | ||||||||||||||||||||||||||||||||||||||||||||||||||||||||||||||
| Three Months Ended March 31, 2022 compared to Three Months Ended March 31, 2021 | ||||||||||||||||||||||||||||||||||||||||||||||||||||||||||||||
| Rentable Square Feet | Occupancy at Period End | Average Occupancy | Average Annualized Rental Revenue per Occupied Square Foot | |||||||||||||||||||||||||||||||||||||||||||||||||||||||||||
MSA(1)
|
Units | 1Q 2022 | 1Q 2021 | Growth | 1Q 2022 | 1Q 2021 | Growth | 1Q 2022 | 1Q 2021 | Growth | ||||||||||||||||||||||||||||||||||||||||||||||||||||
| Portland-Vancouver-Hillsboro, OR-WA | 18,214 | 2,227,631 | 91.8 | % | 89.5 | % | 2.3 | % | 91.2 | % | 88.3 | % | 2.9 | % | $ | 18.41 | $ | 16.86 | 9.2 | % | ||||||||||||||||||||||||||||||||||||||||||
| Riverside-San Bernardino-Ontario, CA | 24,664 | 3,317,527 | 96.3 | % | 98.3 | % | (2.0) | % | 96.9 | % | 97.7 | % | (0.8) | % | 14.67 | 12.26 | 19.7 | % | ||||||||||||||||||||||||||||||||||||||||||||
| Atlanta-Sandy Springs-Roswell, GA | 13,420 | 1,820,613 | 96.4 | % | 93.9 | % | 2.5 | % | 96.8 | % | 92.3 | % | 4.5 | % | 12.19 | 10.36 | 17.7 | % | ||||||||||||||||||||||||||||||||||||||||||||
| Phoenix-Mesa-Scottsdale, AZ | 13,294 | 1,505,889 | 93.7 | % | 93.8 | % | (0.1) | % | 94.1 | % | 92.1 | % | 2.0 | % | 15.60 | 13.65 | 14.3 | % | ||||||||||||||||||||||||||||||||||||||||||||
| McAllen-Edinburg-Mission, TX | 9,293 | 1,389,355 | 97.9 | % | 94.1 | % | 3.8 | % | 97.9 | % | 93.1 | % | 4.8 | % | 11.92 | 10.44 | 14.2 | % | ||||||||||||||||||||||||||||||||||||||||||||
| Oklahoma City, OK | 8,828 | 1,282,227 | 96.9 | % | 93.8 | % | 3.1 | % | 96.7 | % | 93.1 | % | 3.6 | % | 9.03 | 8.14 | 10.9 | % | ||||||||||||||||||||||||||||||||||||||||||||
| Houston-The Woodlands-Sugar Land, TX | 8,540 | 1,346,656 | 94.6 | % | 88.0 | % | 6.6 | % | 94.8 | % | 87.7 | % | 7.1 | % | 11.08 | 10.59 | 4.6 | % | ||||||||||||||||||||||||||||||||||||||||||||
| Dallas-Fort Worth-Arlington, TX | 7,118 | 953,688 | 95.3 | % | 92.6 | % | 2.7 | % | 94.2 | % | 90.6 | % | 3.6 | % | 13.14 | 11.73 | 12.0 | % | ||||||||||||||||||||||||||||||||||||||||||||
| Brownsville-Harlingen, TX | 6,329 | 907,046 | 97.4 | % | 92.5 | % | 4.9 | % | 97.1 | % | 91.3 | % | 5.8 | % | 11.33 | 10.03 | 13.0 | % | ||||||||||||||||||||||||||||||||||||||||||||
| Indianapolis-Carmel-Anderson, IN | 8,741 | 1,133,893 | 96.3 | % | 95.4 | % | 0.9 | % | 95.6 | % | 94.1 | % | 1.5 | % | 11.25 | 9.92 | 13.4 | % | ||||||||||||||||||||||||||||||||||||||||||||
| Los Angeles-Long Beach-Anaheim, CA | 9,751 | 1,063,390 | 94.9 | % | 95.1 | % | (0.2) | % | 95.3 | % | 94.0 | % | 1.3 | % | 22.16 | 19.82 | 11.8 | % | ||||||||||||||||||||||||||||||||||||||||||||
| New Orleans-Metairie, LA | 6,541 | 758,448 | 94.1 | % | 86.3 | % | 7.8 | % | 93.3 | % | 85.2 | % | 8.1 | % | 13.37 | 12.59 | 6.2 | % | ||||||||||||||||||||||||||||||||||||||||||||
| North Port-Sarasota-Bradenton, FL | 8,506 | 838,160 | 94.2 | % | 94.1 | % | 0.1 | % | 95.0 | % | 92.8 | % | 2.2 | % | 20.03 | 16.61 | 20.6 | % | ||||||||||||||||||||||||||||||||||||||||||||
| Tulsa, OK | 6,116 | 814,770 | 94.2 | % | 92.0 | % | 2.2 | % | 92.8 | % | 91.2 | % | 1.6 | % | 9.78 | 9.03 | 8.3 | % | ||||||||||||||||||||||||||||||||||||||||||||
| Las Vegas-Henderson-Paradise, NV | 6,553 | 804,359 | 95.5 | % | 94.7 | % | 0.8 | % | 94.8 | % | 94.0 | % | 0.8 | % | 14.22 | 12.06 | 17.9 | % | ||||||||||||||||||||||||||||||||||||||||||||
| Colorado Springs, CO | 4,348 | 538,557 | 92.8 | % | 95.0 | % | (2.2) | % | 92.0 | % | 92.5 | % | (0.5) | % | 12.33 | 10.64 | 15.9 | % | ||||||||||||||||||||||||||||||||||||||||||||
| Kansas City, MO-KS | 4,003 | 540,049 | 94.5 | % | 92.6 | % | 1.9 | % | 93.1 | % | 90.1 | % | 3.0 | % | 13.88 | 12.80 | 8.4 | % | ||||||||||||||||||||||||||||||||||||||||||||
| San Antonio-New Braunfels, TX | 4,413 | 560,464 | 92.9 | % | 94.8 | % | (1.9) | % | 93.8 | % | 92.7 | % | 1.1 | % | 14.75 | 12.98 | 13.6 | % | ||||||||||||||||||||||||||||||||||||||||||||
| Other MSAs | 133,114 | 16,764,142 | 94.4 | % | 93.3 | % | 1.1 | % | 94.3 | % | 92.0 | % | 2.3 | % | 14.21 | 12.52 | 13.5 | % | ||||||||||||||||||||||||||||||||||||||||||||
| Total/Weighted Average | 301,786 | 38,566,864 | 94.8 | % | 93.4 | % | 1.4 | % | 94.7 | % | 92.2 | % | 2.5 | % | $ | 14.10 | $ | 12.43 | 13.4 | % | ||||||||||||||||||||||||||||||||||||||||||
2021 Same Store Pool(2)
|
266,883 | 33,768,298 | 94.9 | % | 93.8 | % | 1.1 | % | 94.8 | % | 92.5 | % | 2.3 | % | $ | 14.25 | $ | 12.54 | 13.6 | % | ||||||||||||||||||||||||||||||||||||||||||
2020 Same Store Pool(3)
|
237,747 | 30,007,460 | 94.9 | % | 94.0 | % | 0.9 | % | 94.8 | % | 92.7 | % | 2.1 | % | $ | 14.20 | $ | 12.48 | 13.8 | % | ||||||||||||||||||||||||||||||||||||||||||
(1) MSA (Metropolitan Statistical Area) as defined by the United States Census Bureau. | ||||||||||||||||||||
| (2) Represents the subset of properties included in the 2022 same store pool that were in NSA's same store pool reported in 2021. | ||||||||||||||||||||
| (3) Represents the subset of properties included in the 2022 same store pool that were in NSA's same store pool reported in 2020. | ||||||||||||||||||||
20
| Supplemental Schedule 8 | |||||||||||||||||||||||||||||
Same Store Operating Data (631 Stores) - Trailing Five Quarters | |||||||||||||||||||||||||||||
| (dollars in thousands, except per square foot data) (unaudited) | |||||||||||||||||||||||||||||
| 1Q 2022 | 4Q 2021 | 3Q 2021 | 2Q 2021 | 1Q 2021 | |||||||||||||||||||||||||
| Revenue | |||||||||||||||||||||||||||||
| Rental revenue | $ | 128,308 | $ | 126,410 | $ | 123,323 | $ | 115,889 | $ | 109,688 | |||||||||||||||||||
| Other property-related revenue | 4,311 | 4,354 | 4,416 | 4,394 | 4,039 | ||||||||||||||||||||||||
| Total revenue | 132,619 | 130,764 | 127,739 | 120,283 | 113,727 | ||||||||||||||||||||||||
| Property operating expenses | |||||||||||||||||||||||||||||
| Store payroll and related costs | 10,060 | 10,589 | 10,041 | 9,972 | 10,109 | ||||||||||||||||||||||||
| Property tax expense | 9,724 | 8,993 | 9,655 | 9,415 | 9,443 | ||||||||||||||||||||||||
| Utilities expense | 3,437 | 3,100 | 3,772 | 2,899 | 3,220 | ||||||||||||||||||||||||
| Repairs & maintenance expense | 2,720 | 2,894 | 2,935 | 2,736 | 2,648 | ||||||||||||||||||||||||
| Marketing expense | 2,038 | 1,879 | 2,013 | 2,156 | 2,082 | ||||||||||||||||||||||||
| Insurance expense | 1,178 | 1,307 | 1,173 | 1,163 | 1,118 | ||||||||||||||||||||||||
| Other property operating expenses | 5,160 | 5,246 | 5,033 | 4,823 | 4,664 | ||||||||||||||||||||||||
| Total property operating expenses | 34,317 | 34,008 | 34,622 | 33,164 | 33,284 | ||||||||||||||||||||||||
| Net operating income | $ | 98,302 | $ | 96,756 | $ | 93,117 | $ | 87,119 | $ | 80,443 | |||||||||||||||||||
| Net operating income margin | 74.1 | % | 74.0 | % | 72.9 | % | 72.4 | % | 70.7 | % | |||||||||||||||||||
| Occupancy at period end | 94.8 | % | 95.0 | % | 96.1 | % | 96.6 | % | 93.4 | % | |||||||||||||||||||
| Average occupancy | 94.7 | % | 95.6 | % | 96.5 | % | 95.2 | % | 92.2 | % | |||||||||||||||||||
Average annualized rental revenue per occupied square foot |
$ | 14.10 | $ | 13.79 | $ | 13.34 | $ | 12.73 | $ | 12.43 | |||||||||||||||||||
21
| Supplemental Schedule 9 | |||||||||||||||||||||||||||||
| Reconciliation of Same Store Data and Net Operating Income to Net Income | |||||||||||||||||||||||||||||
| (dollars in thousands) (unaudited) | |||||||||||||||||||||||||||||
| 1Q 2022 | 4Q 2021 | 3Q 2021 | 2Q 2021 | 1Q 2021 | |||||||||||||||||||||||||
| Rental revenue | |||||||||||||||||||||||||||||
Same store portfolio |
$ | 128,308 | $ | 126,410 | $ | 123,323 | $ | 115,889 | $ | 109,688 | |||||||||||||||||||
Non-same store portfolio |
46,161 | 35,280 | 16,097 | 11,421 | 3,439 | ||||||||||||||||||||||||
Total rental revenue |
174,469 | 161,690 | 139,420 | 127,310 | 113,127 | ||||||||||||||||||||||||
| Other property-related revenue | |||||||||||||||||||||||||||||
Same store portfolio |
4,311 | 4,354 | 4,416 | 4,394 | 4,039 | ||||||||||||||||||||||||
Non-same store portfolio |
1,855 | 1,289 | 725 | 435 | 98 | ||||||||||||||||||||||||
Total other property-related revenue |
6,166 | 5,643 | 5,141 | 4,829 | 4,137 | ||||||||||||||||||||||||
| Property operating expenses | |||||||||||||||||||||||||||||
Same store portfolio |
34,317 | 34,008 | 34,622 | 33,164 | 33,284 | ||||||||||||||||||||||||
Non-same store portfolio |
15,041 | 10,768 | 5,025 | 3,620 | 1,456 | ||||||||||||||||||||||||
Prior period comparability adjustment(1)
|
— | (234) | (182) | (130) | (136) | ||||||||||||||||||||||||
Total property operating expenses |
49,358 | 44,542 | 39,465 | 36,654 | 34,604 | ||||||||||||||||||||||||
| Net operating income | 131,277 | 122,791 | 105,096 | 95,485 | 82,660 | ||||||||||||||||||||||||
| Management fees and other revenue | 6,549 | 6,257 | 6,282 | 6,107 | 5,728 | ||||||||||||||||||||||||
| General and administrative expenses | (13,966) | (14,301) | (13,012) | (12,450) | (11,238) | ||||||||||||||||||||||||
| Depreciation and amortization | (58,072) | (50,854) | (38,983) | (36,051) | (32,424) | ||||||||||||||||||||||||
| Other | (470) | (1,152) | (994) | (310) | (397) | ||||||||||||||||||||||||
| Interest expense | (22,647) | (19,787) | (18,144) | (17,339) | (16,792) | ||||||||||||||||||||||||
| Equity in earnings of unconsolidated real estate ventures | 1,494 | 1,679 | 1,682 | 1,174 | 759 | ||||||||||||||||||||||||
| Acquisition costs | (553) | (1,019) | (512) | (118) | (292) | ||||||||||||||||||||||||
| Non-operating expense | (112) | (344) | (241) | (148) | (173) | ||||||||||||||||||||||||
| Gain on sale of self storage properties | 2,134 | — | — | — | — | ||||||||||||||||||||||||
| Income tax expense | (848) | (375) | (444) | (675) | (196) | ||||||||||||||||||||||||
| Net Income | $ | 44,786 | $ | 42,895 | $ | 40,730 | $ | 35,675 | $ | 27,635 | |||||||||||||||||||
| (1) Certain payroll and related costs associated with the Northwest portfolio were not reflected as property-level expenses in 2021 under the management of the Northwest PRO. Such costs are reflected in property operating expenses in 2022 under NSA's management. For purposes of comparable same store reporting, NSA has included the specific 2021 expense amounts for the same store portfolio in the relevant periods. This line item is presented in order to reconcile total property operating expenses to previously reported figures. | ||||||||||||||||||||
22
| Supplemental Schedule 10 | |||||||||||
| Selected Financial Information | |||||||||||
| (dollars in thousands, except per square foot data) (unaudited) | |||||||||||
| Three Months Ended March 31, | |||||||||||
| 2022 | 2021 | ||||||||||
| Average Annualized Rental Revenue Per Occupied Square Foot | |||||||||||
Same store |
$ | 14.10 | $ | 12.43 | |||||||
Total consolidated portfolio |
13.65 | 12.34 | |||||||||
| Average Occupancy | |||||||||||
Same store |
94.7 | % | 92.2 | % | |||||||
Total consolidated portfolio |
92.5 | % | 91.8 | % | |||||||
| Total Consolidated Portfolio Capital Expenditures | |||||||||||
Recurring capital expenditures |
$ | 2,239 | $ | 2,102 | |||||||
| Value enhancing capital expenditures | 2,241 | 2,239 | |||||||||
Acquisitions capital expenditures |
3,451 | 2,034 | |||||||||
| Total consolidated portfolio capital expenditures | $ | 7,931 | $ | 6,375 | |||||||
| Property Operating Expenses Detail | |||||||||||
| Store payroll and related costs | $ | 13,845 | $ | 10,371 | |||||||
| Property tax expense | 14,422 | 9,941 | |||||||||
| Utilities expense | 5,056 | 3,154 | |||||||||
| Repairs & maintenance expense | 4,110 | 2,764 | |||||||||
| Marketing expense | 2,938 | 2,170 | |||||||||
| Insurance expense | 1,756 | 1,166 | |||||||||
| Other property operating expenses | 7,231 | 5,038 | |||||||||
Property operating expenses on the Company's statements of operations |
$ | 49,358 | $ | 34,604 | |||||||
| General and Administrative Expenses Detail | |||||||||||
| Supervisory and administrative expenses | $ | 5,316 | $ | 4,247 | |||||||
| Equity-based compensation expense | 1,544 | 1,286 | |||||||||
| Other general and administrative expenses | 7,106 | 5,705 | |||||||||
General and administrative expenses on the Company's statements of operations |
$ | 13,966 | $ | 11,238 | |||||||
23
Glossary
This Earnings Release and Supplemental Financial Information includes certain financial and operating measures used by NSA management that are not calculated in accordance with accounting principles generally accepted in the United States, or GAAP. NSA's definitions and calculations of these non-GAAP financial and operating measures and other terms may differ from the definitions and methodologies used by other real estate companies and, accordingly, may not be comparable. These non-GAAP financial and operating measures should not be considered an alternative to GAAP net income or any other GAAP measurement of performance and should not be considered an alternative measure of liquidity.
2016 JOINT VENTURE: NSA's 2016 Joint Venture was formed in 2016 with a major state pension fund advised by Heitman Capital Management LLC. NSA's ownership in the 2016 Joint Venture is 25% and NSA earns customary fees for managing and operating the 2016 Joint Venture properties. In connection with the 2016 Joint Venture’s acquisition of an initial portfolio of self storage properties, NSA separately acquired the property management platform related to the initial portfolio, including a property management company, and related intellectual property, including the iStorage brand, under which NSA's management platform operates the 2016 Joint Venture.
2018 JOINT VENTURE: NSA's 2018 Joint Venture was formed in 2018 with an affiliate of Heitman America Real Estate REIT LLC to acquire a portfolio of over 100 self storage properties. NSA's ownership in the 2018 Joint Venture is 25% and NSA earns customary fees for managing and operating the 2018 Joint Venture properties. The 2018 Joint Venture properties are operated by NSA’s management platform under NSA’s iStorage and SecurCare brands.
AVERAGE ANNUALIZED RENTAL REVENUE PER OCCUPIED SQUARE FOOT: Average annualized rental revenue per occupied square foot is computed by dividing annualized rental revenue (including fees and net of any discounts and uncollectible customer amounts) by average occupied square feet.
AVERAGE OCCUPANCY: Average occupancy is calculated based on the average of the month-end occupancy immediately preceding the period presented and the month-end occupancies included in the respective period presented.
CAPITAL EXPENDITURES DEFINITIONS
ACQUISITIONS CAPITAL EXPENDITURES: Acquisitions capital expenditures represents the portion of capital expenditures capitalized during the current period that were identified and underwritten prior to a property's acquisition.
RECURRING CAPITAL EXPENDITURES: Recurring capital expenditures represents the portion of capital expenditures that are deemed to replace the consumed portion of acquired capital assets and extend their useful lives.
VALUE ENHANCING CAPITAL EXPENDITURES: Value enhancing capital expenditures represents the portion of capital expenditures that are made to enhance the revenue and value of an asset from its original purchase condition.
EBITDA: NSA defines EBITDA as net income (loss), as determined under GAAP, plus interest expense, loss on early extinguishment of debt, income taxes, depreciation and amortization expense and the Company's share of unconsolidated real estate venture depreciation and amortization. NSA defines ADJUSTED EBITDA as EBITDA plus acquisition costs, organizational and offering expenses, equity-based compensation expense, losses on sale of properties and impairment of long-lived assets, minus gains on sale of properties and debt forgiveness, and after adjustments for unconsolidated partnerships and joint ventures. These further adjustments eliminate the impact of items that the Company does not consider indicative of its core operating performance. In evaluating EBITDA and Adjusted EBITDA, you should be aware that in the future the Company may incur expenses that are the same as or similar to some of the adjustments in this presentation. NSA's presentation of EBITDA and Adjusted EBITDA should not be construed as an inference that its future results will be unaffected by unusual or non-recurring items.
NSA presents EBITDA and Adjusted EBITDA because the Company believes they assist investors and analysts in comparing the Company's performance across reporting periods on a consistent basis by excluding items that the Company does not believe are indicative of its core operating performance. EBITDA and Adjusted EBITDA have limitations as an analytical tool. Some of these limitations are:
24
•EBITDA and Adjusted EBITDA do not reflect the Company's cash expenditures, or future requirements, for capital expenditures, contractual commitments or working capital needs;
•EBITDA and Adjusted EBITDA do not reflect the significant interest expense, or the cash requirements necessary to service interest or principal payments, on the Company's debts;
•although depreciation and amortization are non-cash charges, the assets being depreciated and amortized will often have to be replaced in the future, and EBITDA and Adjusted EBITDA do not reflect any cash requirements for such replacements;
•Adjusted EBITDA excludes equity-based compensation expense, which is and will remain a key element of the Company's overall long-term incentive compensation package, although the Company excludes it as an expense when evaluating its ongoing operating performance for a particular period;
•EBITDA and Adjusted EBITDA do not reflect the impact of certain cash charges resulting from matters the Company considers not to be indicative of its ongoing operations; and
•other companies in NSA's industry may calculate EBITDA and Adjusted EBITDA differently than NSA does, limiting their usefulness as comparative measures.
NSA compensates for these limitations by considering the economic effect of the excluded expense items independently as well as in connection with the Company's analysis of net income (loss). EBITDA and Adjusted EBITDA should be considered in addition to, but not as a substitute for, other measures of financial performance reported in accordance with GAAP, such as total revenues and net income (loss).
FUNDS FROM OPERATIONS: Funds from operations, or FFO, is a widely used performance measure for real estate companies and is provided here as a supplemental measure of the Company's operating performance. The December 2018 Nareit Funds From Operations White Paper - 2018 Restatement, which the Company refers to as the White Paper, defines FFO as net income (as determined under GAAP), excluding: real estate depreciation and amortization, gains and losses from the sale of certain real estate assets, gains and losses from change in control, mark-to-market changes in value recognized on equity securities, impairment write-downs of certain real estate assets and impairment of investments in entities when it is directly attributable to decreases in the value of depreciable real estate held by the entity and after items to record unconsolidated partnerships and joint ventures on the same basis. Distributions declared on subordinated performance units and DownREIT subordinated performance units represent NSA's allocation of FFO to noncontrolling interests held by subordinated performance unitholders and DownREIT subordinated performance unitholders. For purposes of calculating FFO attributable to common shareholders, OP unitholders, and LTIP unitholders, NSA excludes distributions declared on subordinated performance units, DownREIT subordinated performance units, preferred shares and preferred units. NSA defines CORE FFO as FFO, as further adjusted to eliminate the impact of certain items that the Company does not consider indicative of its core operating performance. These further adjustments consist of acquisition costs, organizational and offering costs, gains on debt forgiveness, gains (losses) on early extinguishment of debt, and after adjustments for unconsolidated partnerships and joint ventures.
Management uses FFO and Core FFO as key performance indicators in evaluating the operations of NSA's properties. Given the nature of NSA's business as a real estate owner and operator, the Company considers FFO and Core FFO as key supplemental measures of its operating performance that are not specifically defined by GAAP. NSA believes that FFO and Core FFO are useful to management and investors as a starting point in measuring the Company's operational performance because FFO and Core FFO exclude various items included in net income (loss) that do not relate to or are not indicative of the Company's operating performance such as gains (or losses) from sales of self storage properties and depreciation, which can make periodic and peer analyses of operating performance more difficult. NSA's computation of FFO and Core FFO may not be comparable to FFO reported by other REITs or real estate companies.
FFO and Core FFO should be considered in addition to, but not as a substitute for, other measures of financial performance reported in accordance with GAAP, such as total revenues, operating income and net income (loss). FFO and Core FFO do not represent cash generated from operating activities determined in accordance with GAAP and are not a measure of liquidity or an indicator of NSA's ability to make cash distributions. NSA believes that to further understand the Company's performance, FFO and Core FFO should be compared with the Company's reported net income (loss) and considered in addition to cash flows computed in accordance with GAAP, as presented in the Company's consolidated financial statements.
HYPOTHETICAL LIQUIDATION AT BOOK VALUE METHOD: In accordance with GAAP, the Company allocates income (loss) utilizing the hypothetical liquidation at book value ("HLBV") method, in which the Company allocates
25
income or loss based on the change in each unitholders’ claim on the net assets of the Company's operating partnership at period end after adjusting for any distributions or contributions made during such period. The Company uses this method because of the difference between the distribution rights and priorities set forth in the operating partnership's Agreement of Limited Partnership and what is reflected by the underlying percentage ownership interests of the unitholders.
The HLBV method is a balance sheet-focused approach to income (loss) allocation. A calculation is prepared at each balance sheet date to determine the amount that unitholders would receive if the operating partnership were to liquidate all of its assets (at GAAP net book value) and distribute the resulting proceeds to its creditors and unitholders based on the contractually defined liquidation priorities. The difference between the calculated liquidation distribution amounts at the beginning and the end of the reporting period, after adjusting for capital contributions and distributions, is used to derive each unitholder's share of the income (loss) for the period. Due to the stated liquidation priorities and because the HLBV method incorporates non-cash items such as depreciation expense, in any given period, income or loss may be allocated disproportionately to unitholders as compared to their respective ownership percentage in the operating partnership, and net income (loss) attributable to National Storage Affiliates Trust could be more or less net income than actual cash distributions received and more or less income or loss than what may be received in the event of an actual liquidation. Additionally, the HLBV method could result in net income (or net loss) attributable to National Storage Affiliates Trust during a period when the Company reports consolidated net loss (or net income), or net income (or net loss) attributable to National Storage Affiliates Trust in excess of the Company's consolidated net income (or net loss). The computations of basic and diluted earnings (loss) per share may be materially affected by these disproportionate income (loss) allocations, resulting in volatile fluctuations of basic and diluted earnings (loss) per share. Readers and investors are cautioned not to place undue reliance on NSA's income (loss) allocations or earnings (loss) per share without considering the effects described above, including the effect that depreciation and amortization have on income (loss), net book value and the application of the HLBV method.
LONG-TERM INCENTIVE PLAN UNITS: Long-term incentive plan units, or LTIP units, are a special class of partnership interest in NSA's operating partnership that allow the holder to participate in the ordinary and liquidating distributions received by holders of the operating partnership units (subject to the achievement of specified levels of profitability by our operating partnership or the achievement of certain events). Upon vesting, and after achieving parity with operating partnership units, vested LTIP units may be converted into an equal number of operating partnership units, and thereafter have all the rights of operating partnership units, including redemption rights.
NET DEBT TO ANNUALIZED CURRENT QUARTER ADJUSTED EBITDA: NSA calculates net debt to Adjusted EBITDA as total debt (inclusive of $4.7 million of fair value of debt adjustments and $12.8 million of debt issuance costs) less cash and cash equivalents, divided by annualized current quarter Adjusted EBITDA.
NET OPERATING INCOME: Net operating income, or NOI, represents rental revenue plus other property-related revenue less property operating expenses. NOI is not a measure of performance calculated in accordance with GAAP.
NSA believes NOI is useful to investors in evaluating the Company's operating performance because:
•NOI is one of the primary measures used by NSA's management and the Company's PROs to evaluate the economic productivity of the Company's properties, including the Company's ability to lease its properties, increase pricing and occupancy and control the Company's property operating expenses;
•NOI is widely used in the real estate industry and the self storage industry to measure the performance and value of real estate assets without regard to various items included in net income that do not relate to or are not indicative of operating performance, such as depreciation and amortization, which can vary depending upon accounting methods, the book value of assets, and the impact of NSA's capital structure; and
•NSA believes NOI helps the Company's investors to meaningfully compare the results of its operating performance from period to period by removing the impact of the Company's capital structure (primarily interest expense on the Company's outstanding indebtedness) and depreciation of the cost basis of NSA's assets from its operating results.
There are material limitations to using a non-GAAP measure such as NOI, including the difficulty associated with comparing results among more than one company and the inability to analyze certain significant items, including depreciation and interest expense, that directly affect the Company's net income (loss). NSA compensates for these limitations by considering the economic effect of the excluded expense items independently as well as in connection with the Company's analysis of net income (loss). NOI should be considered in addition to, but not as a
26
substitute for, other measures of financial performance reported in accordance with GAAP, such as total revenues and net loss.
NET OPERATING INCOME MARGIN: The ratio of NOI divided by total rental and other property-related revenue.
NON-SAME STORE PORTFOLIO: Non-same store portfolio comprises those properties that do not meet the Same Store portfolio property definition.
OCCUPANCY AT PERIOD END: Represents total occupied rentable square feet divided by total rentable square feet at period end.
OPERATING PARTNERSHIP UNITS: Operating partnership units, or OP Units, are Class A common units of limited partner interest in the Company's operating partnership which are economically equivalent to NSA's common shares. NSA also owns certain of the Company's self storage properties through other consolidated limited partnership subsidiaries of the Company's operating partnership, which the Company refers to as "DownREIT partnerships." The DownREIT partnerships issue certain units of limited partner or limited liability company interest that are intended to be economically equivalent to the Company's OP units, which the Company defines as DOWNREIT OPERATING PARTNERSHIP UNIT EQUIVALENTS, or DownREIT OP units.
PROs: Participating regional operators, or "PROs", are NSA's experienced regional self storage operators with local operational focus and expertise. As of March 31, 2022, the Company had nine PROs: Optivest Properties, Guardian Storage Centers, Move It Self Storage, Storage Solutions, Hide-Away, Personal Mini, Southern Self Storage, Moove In Self Storage and Blue Sky Self Storage. Effective January 1, 2022, following the voluntary retirement of Northwest Self Storage as a PRO, the management of Northwest's branded properties was transferred to NSA.
RENTABLE SQUARE FEET: Rentable square feet includes all enclosed self storage units but excludes commercial, residential, and covered parking space.
RESTRICTED COMMON SHARES: Restricted common shares are common shares that are subject to restrictions on transferability subject to vesting and such other restrictions. Generally, a participant granted restricted common shares has all of the rights of a shareholder, including, without limitation, the right to vote and the right to receive dividends on the restricted common shares. Holders of restricted common shares are prohibited from selling such shares until they vest.
SAME STORE PORTFOLIO: NSA's same store portfolio is defined as those properties owned and operated on a stabilized basis since the first day of the earliest year presented. The Company considers a property to be stabilized once it has achieved an occupancy rate that is representative of similar properties in the applicable market. NSA excludes any properties sold, expected to be sold or subject to significant changes such as expansions or casualty events which cause the portfolio's year-over-year operating results to no longer be comparable.
SUBORDINATED PERFORMANCE UNITS: Subordinated performance units, or SP Units, are Class B common units of limited partner interest in the Company's operating partnership. SP units, which are linked to the performance of specific contributed portfolios, are intended to incentivize the Company's PROs to drive operating performance and support the sustainability of the operating cash flow generated by the contributed self storage properties that the PROs continue to manage on NSA's behalf. Because subordinated performance unit holders receive distributions only after portfolio-specific minimum performance thresholds are satisfied, the Company believes SP units play a key role in aligning the interests of the Company's PROs with NSA and the Company's shareholders. The DownREIT partnerships also issue units of limited partner interest that are intended to be economically equivalent to the Company's SP units, which the Company defines as DOWNREIT SUBORDINATED PERFORMANCE UNIT EQUIVALENTS, or DownREIT SP units.
27
| Equity Research Coverage | ||||||||||||||
| Baird | Berenberg Capital Markets |
BMO Capital Markets | ||||||||||||
| Wes Golladay | Keegan Carl |
Juan Sanabria | ||||||||||||
| 216.737.7510 | 646.949.9052 | 312.845.4704 | ||||||||||||
| BofA Securities | Capital One Securities, Inc. | Citi Investment Research | ||||||||||||
| Jeff Spector | Neil Malkin | Michael Bilerman / Smedes Rose | ||||||||||||
| 646.855.1363 | 571.633.8191 | 212.816.1383 / 212.816.6243 | ||||||||||||
| Evercore ISI | Green Street | Jefferies LLC | ||||||||||||
| Samir Khanal / Steve Sakwa | Spenser Allaway | Jonathan Petersen | ||||||||||||
| 212.888.3796 / 212.446.9462 | 949.640.8780 | 212.284.1705 | ||||||||||||
| KeyBanc Capital Markets | Morgan Stanley | Stifel | ||||||||||||
| Todd Thomas | Ronald Kamdem | Stephen Manaker / Kevin Stein | ||||||||||||
| 917.368.2286 / 917.368.2280 | 212.296.8319 | 212.271.3716 / 212.271.3718 | ||||||||||||
| Truist Securities | ||||||||||||||
| Ki Bin Kim | ||||||||||||||
| 212.303.4124 | ||||||||||||||
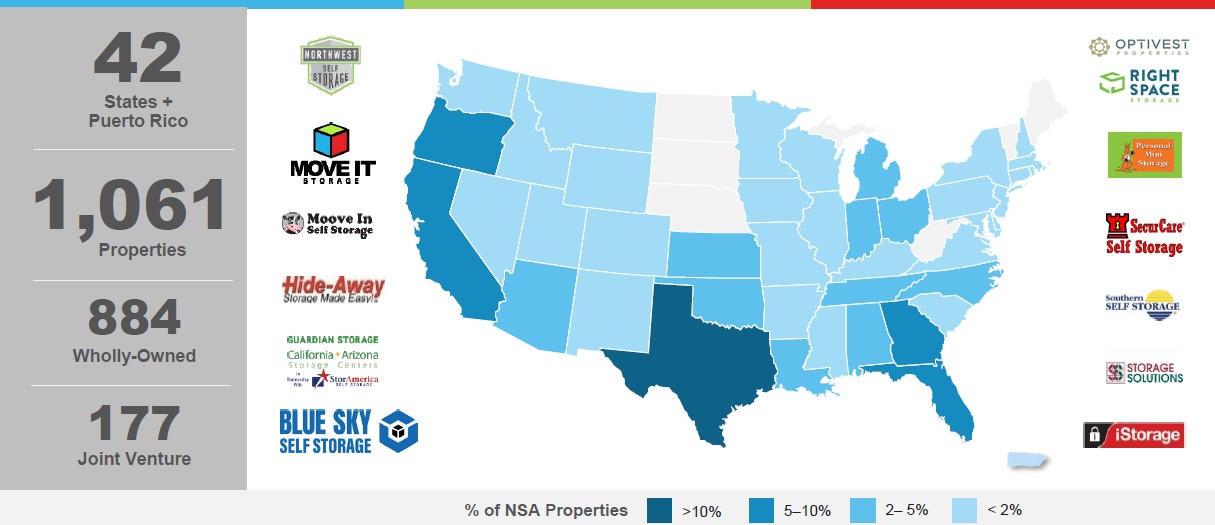
28